Laguna Lathe + Propeller + Raspberry Pi Zero W = Gauge that displays river velocity in knots.
 JohnR2010
Posts: 431
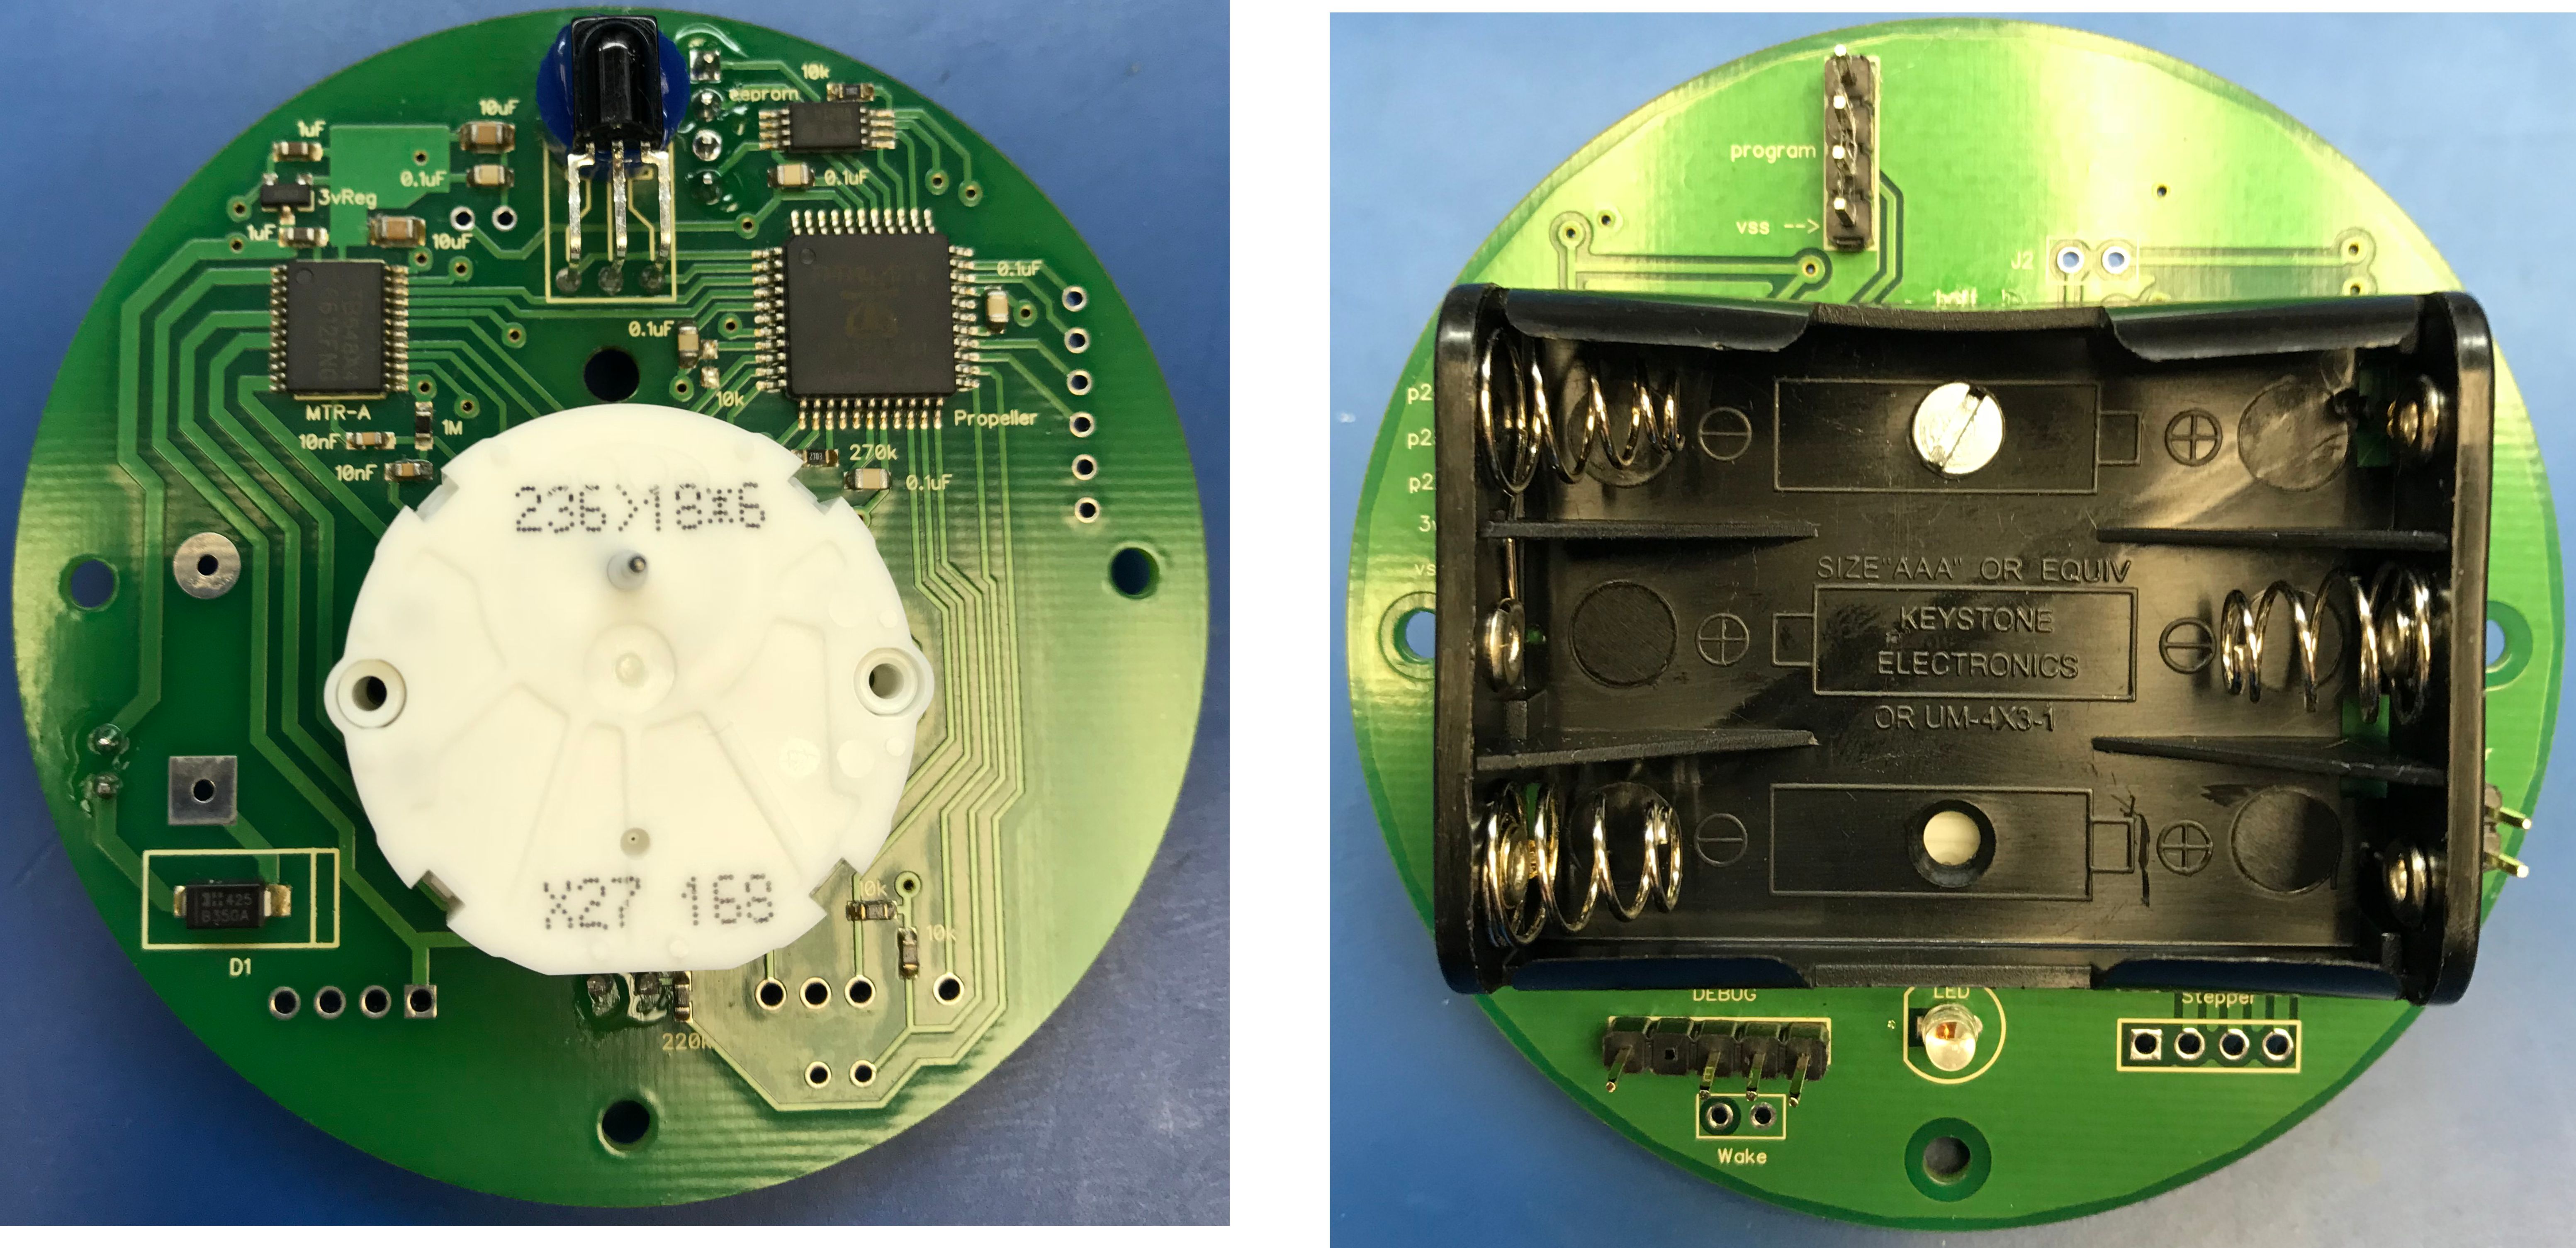
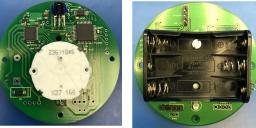
Just before Christmas I got my latest run of PCBs from Bay Area Circuits and thought I would share with the forum. The PCB uses a battery powered propeller to control a small automotive stepper. This allows me to put the PCB (gauge clock works) inside a custom gauge that can sit on a desk or hang on a wall. No wall-wart or external power required! The gauge’s clock works consist of a Propeller (P8X32A-Q44 microcontroller), a TB6612FNGSSOP motor driver, a TSOP38233 infrared receiver, and a small automotive stepper all soldered to one side. On the other side of the PCB you will find a 3 AAA battery pack, a LED, and a few headers.

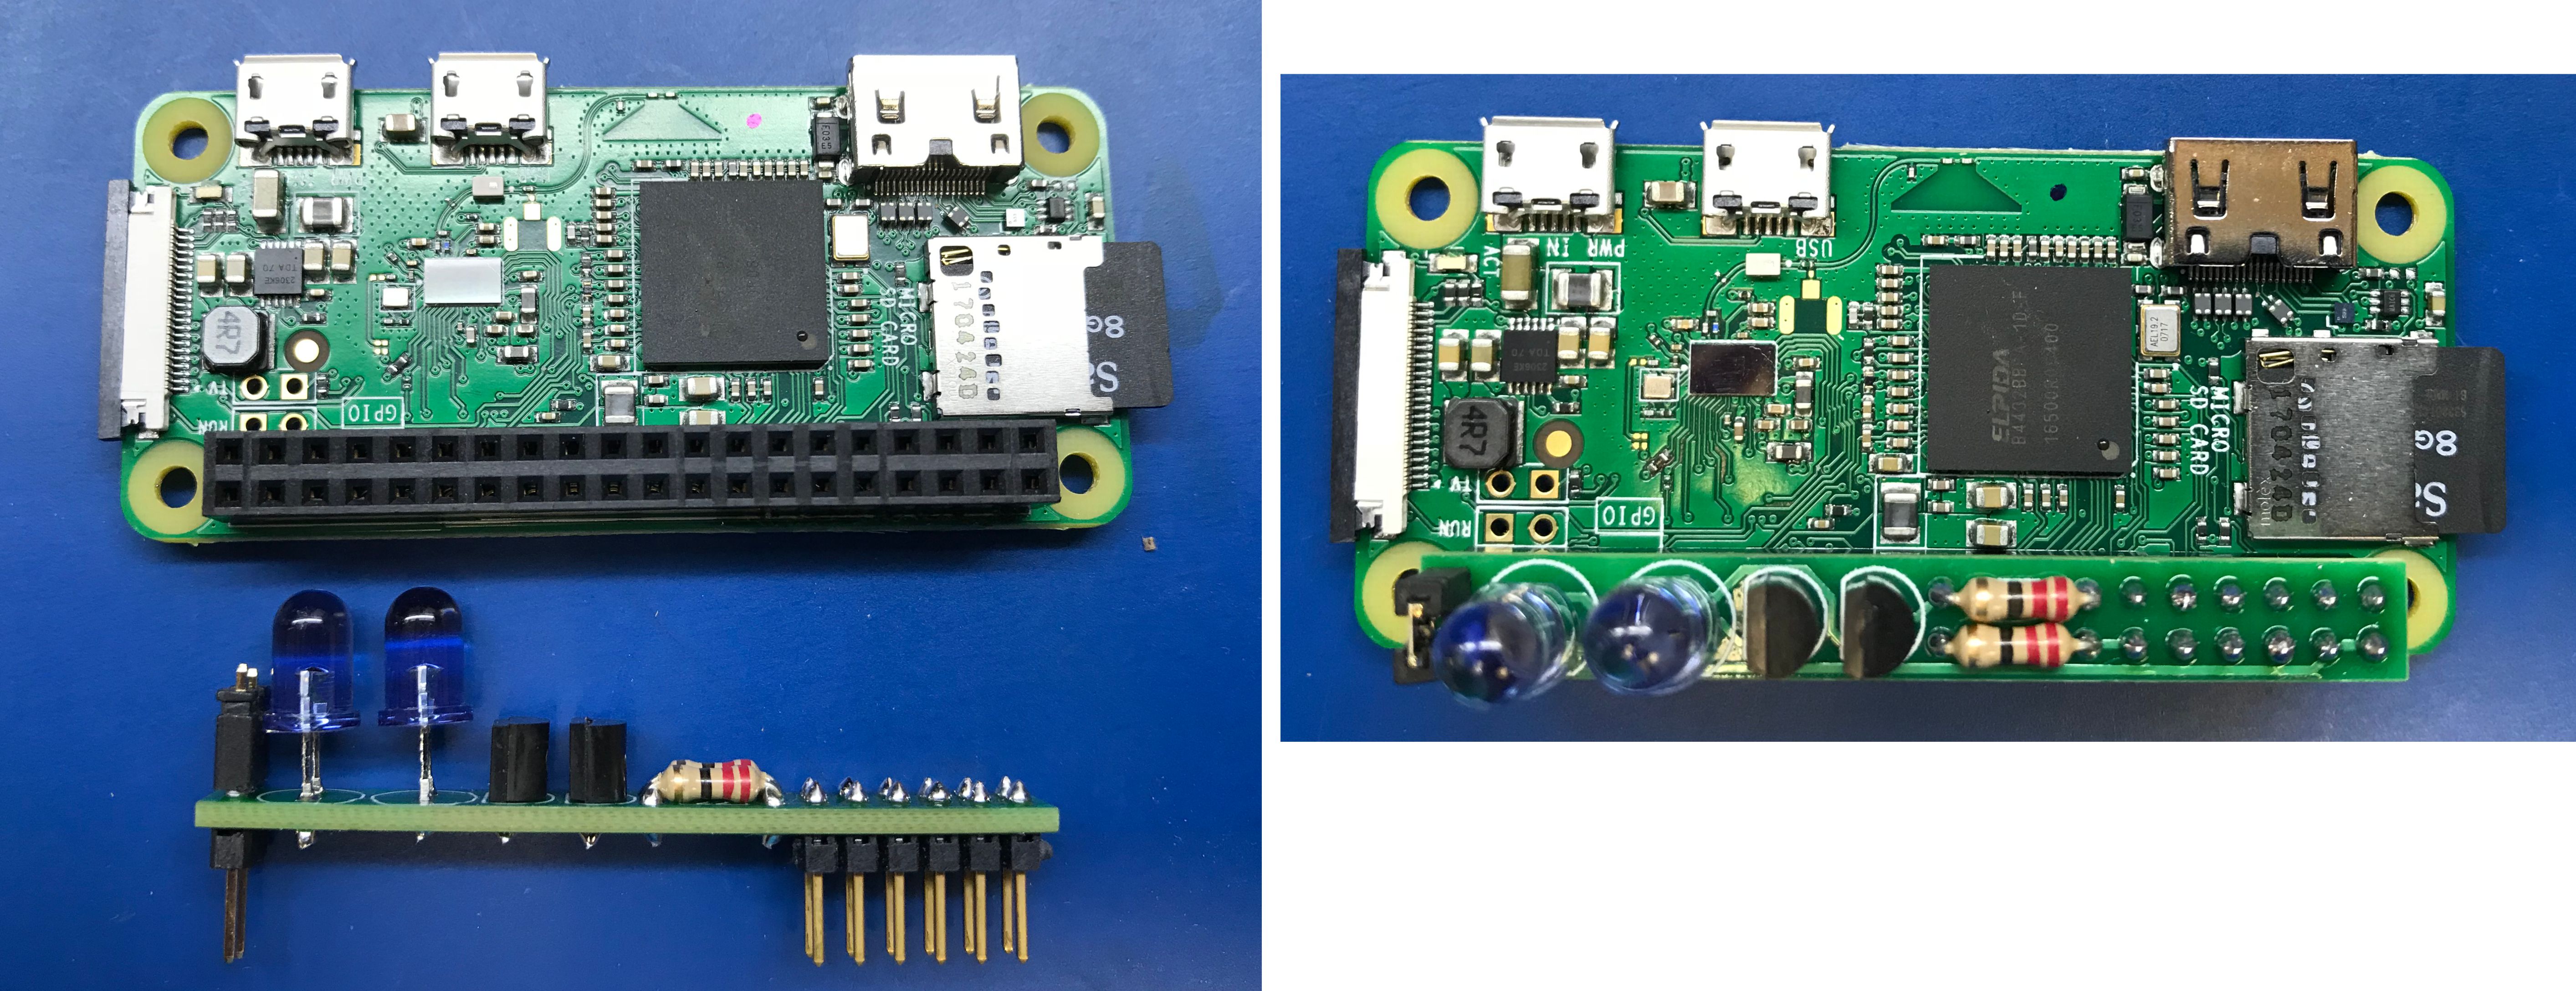
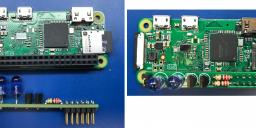
I use two infrared LEDs to send commands to the Propeller from a Raspberry Pi Zero W. The Raspberry Pi is running a Node.JS application that pulls data from the Internet and converts it to a 32-bit packet to be sent to a gauge. Each gauge type has a unique address, so one Raspberry Pi can drive several gauges. The PCB for the Pi is the exact size of the expansion header, so it simply plugs into the top and fits with most cases.
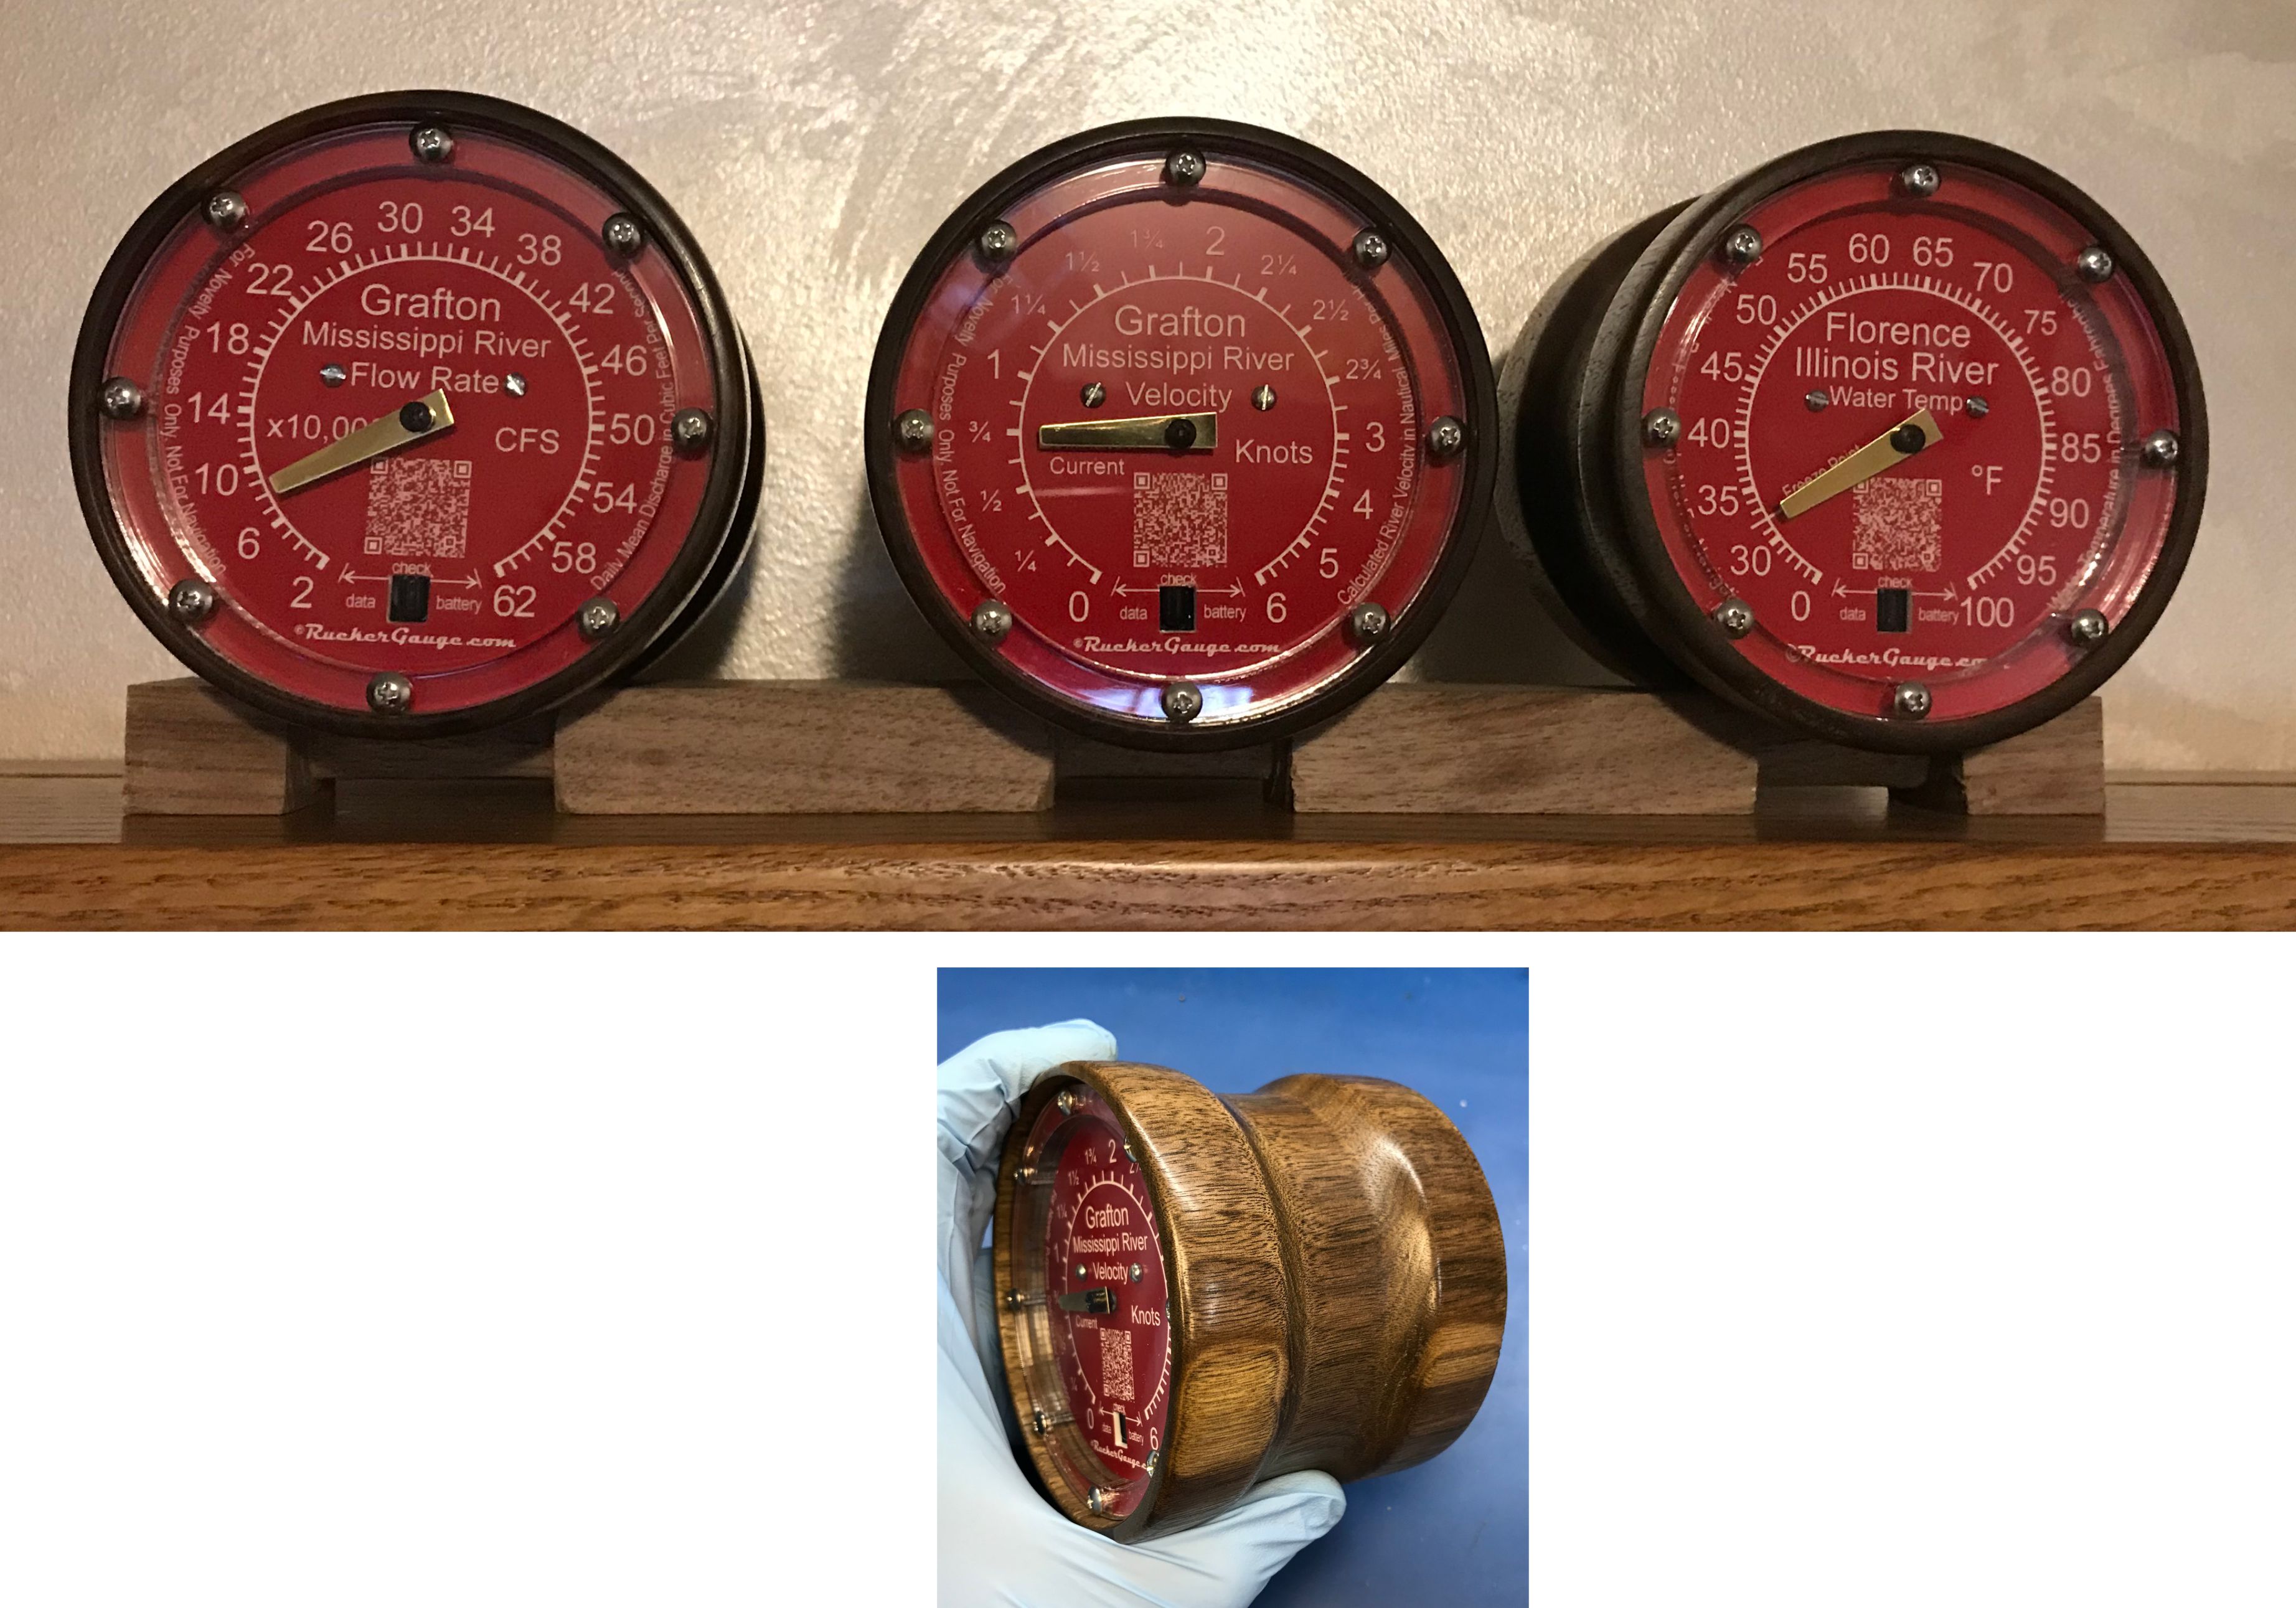
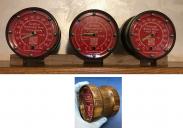
Here is what a few finished gauges look like.
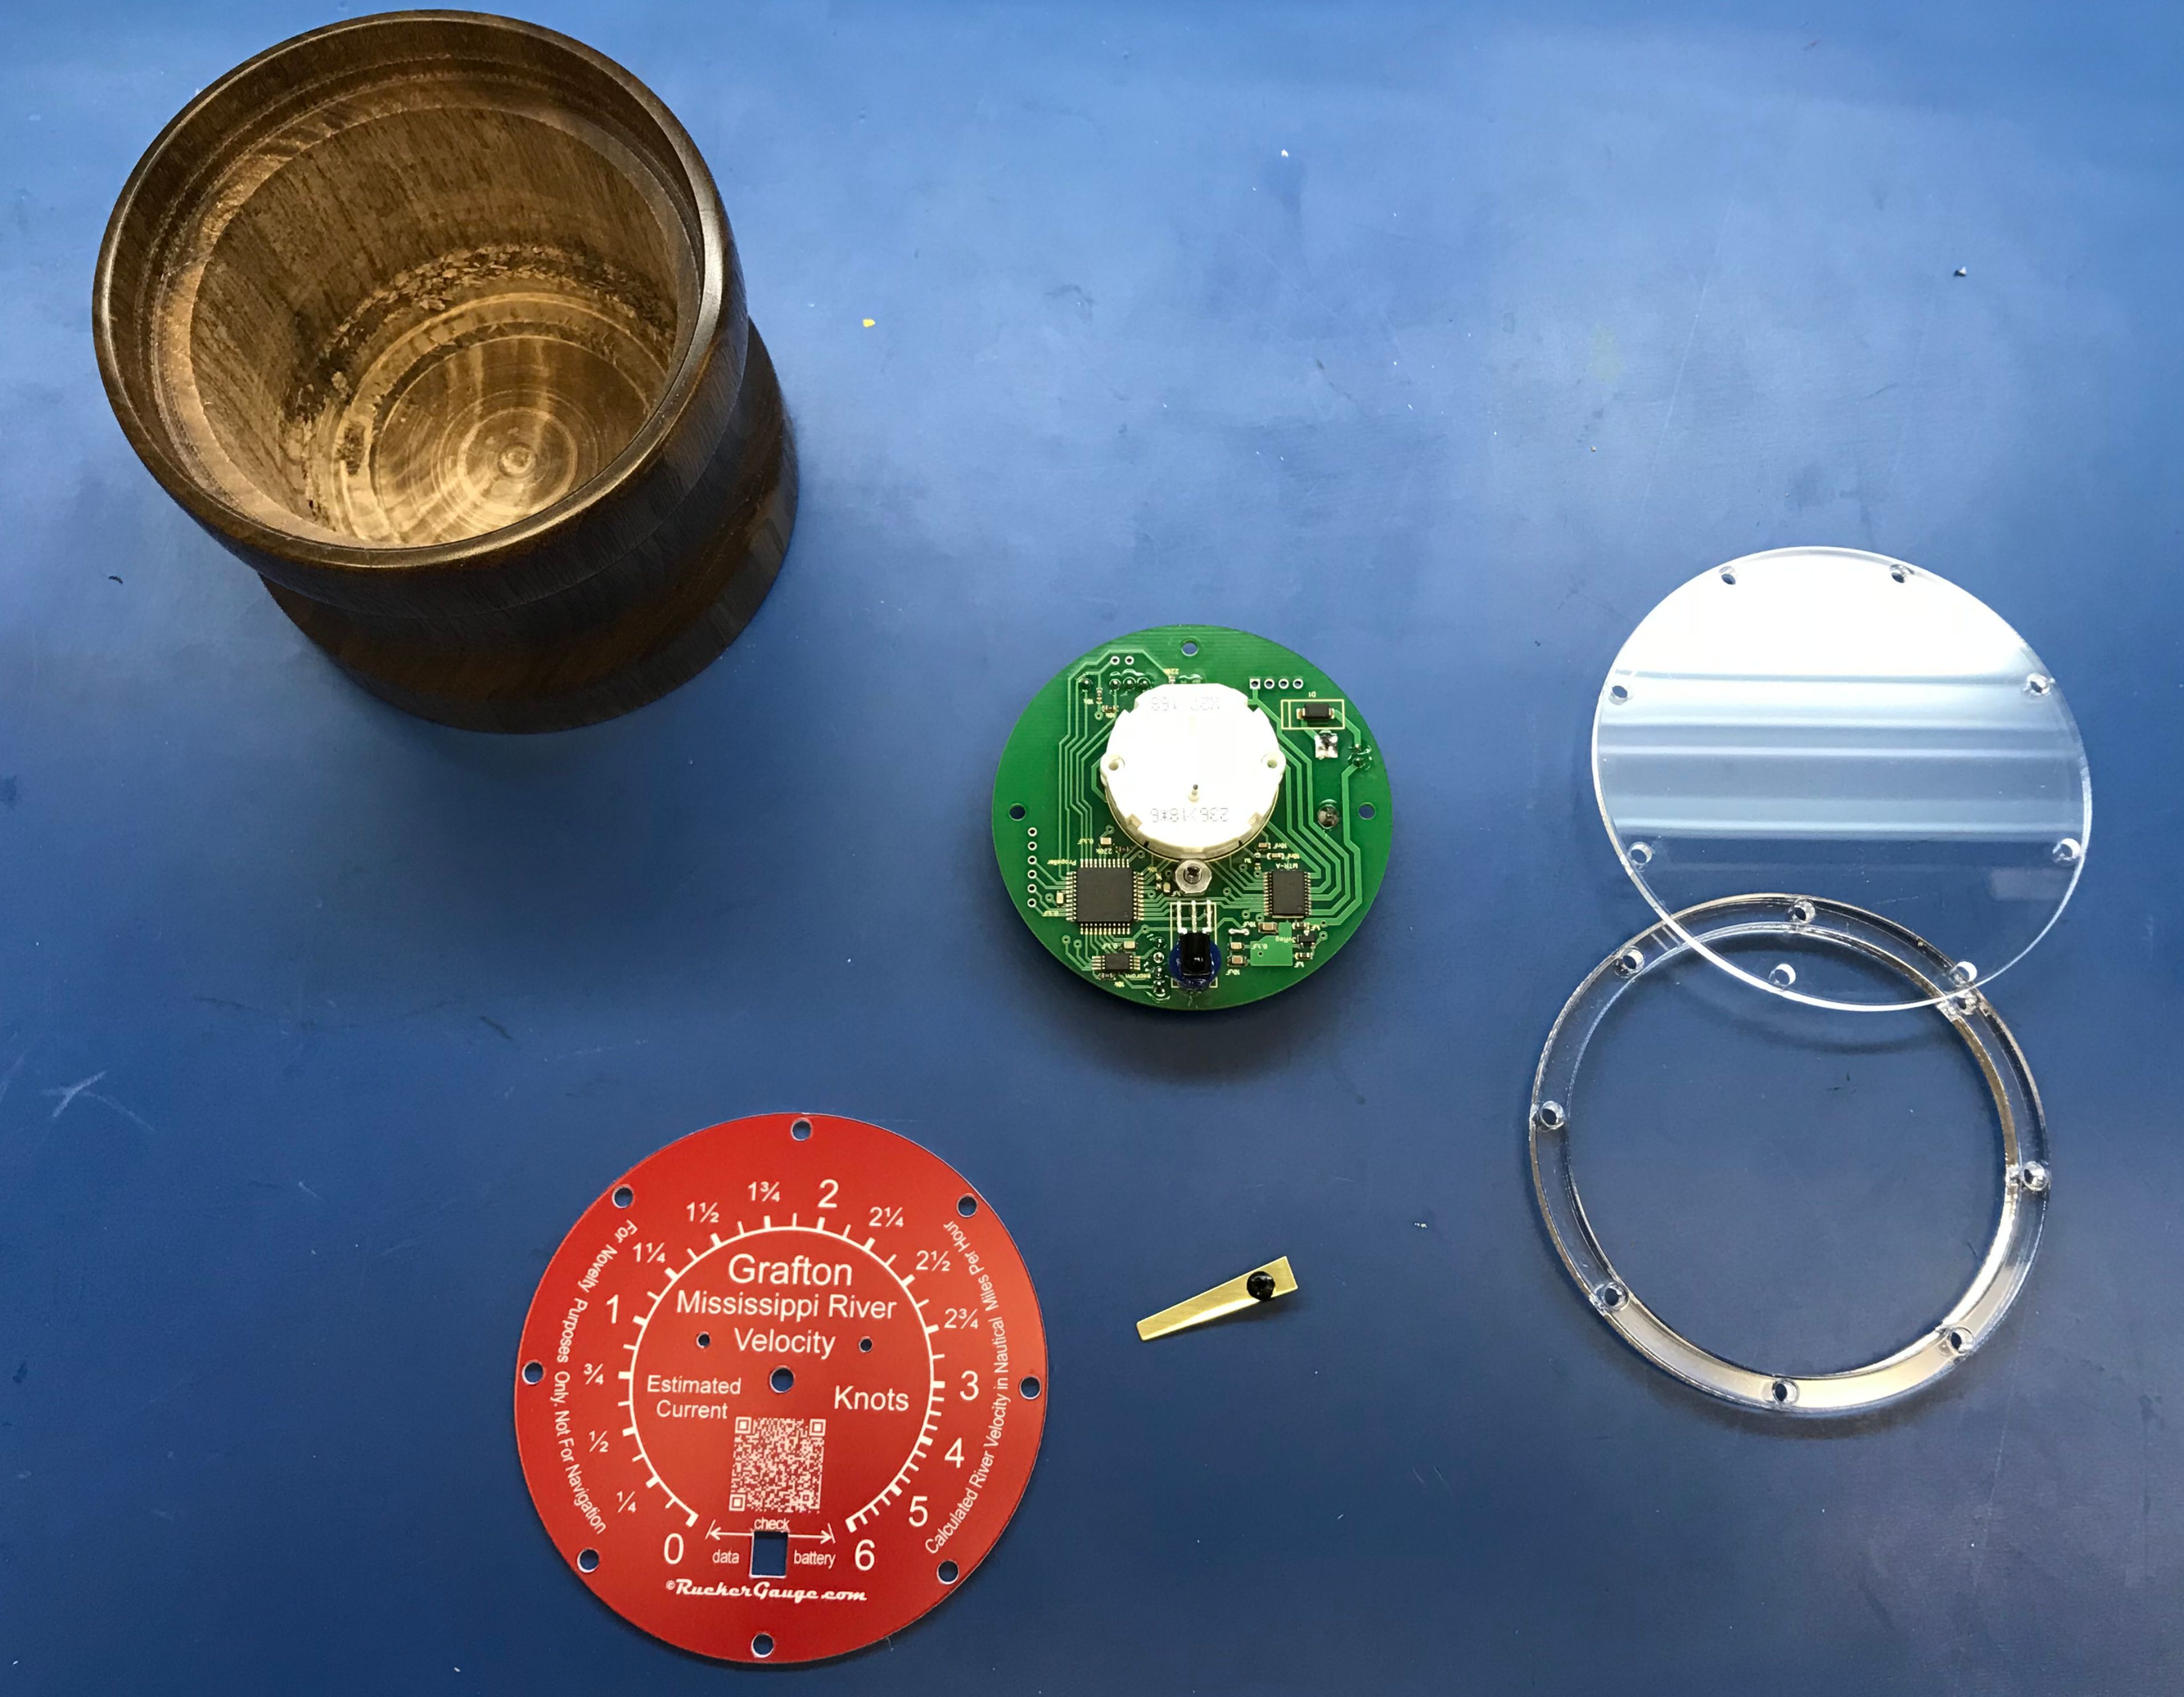
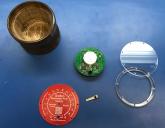
I created these on my Laguna lathe from a walnut tree the boys and I found on our farm. I have a long way to go on my woodworking skills, but it is pretty rewarding to stick a Propeller in a hunk of wood and have it look like this.
I appreciate the help and encouragement I have received in this forum. These posts from last year helped a great deal!
what-is-the-best-infrared-modulation-frequency-for-avoiding-interference
locks-with-pasm
sigma-delta-a-to-d-with-a-20khz-clock


I use two infrared LEDs to send commands to the Propeller from a Raspberry Pi Zero W. The Raspberry Pi is running a Node.JS application that pulls data from the Internet and converts it to a 32-bit packet to be sent to a gauge. Each gauge type has a unique address, so one Raspberry Pi can drive several gauges. The PCB for the Pi is the exact size of the expansion header, so it simply plugs into the top and fits with most cases.

Here is what a few finished gauges look like.


I created these on my Laguna lathe from a walnut tree the boys and I found on our farm. I have a long way to go on my woodworking skills, but it is pretty rewarding to stick a Propeller in a hunk of wood and have it look like this.
I appreciate the help and encouragement I have received in this forum. These posts from last year helped a great deal!
what-is-the-best-infrared-modulation-frequency-for-avoiding-interference
locks-with-pasm
sigma-delta-a-to-d-with-a-20khz-clock


Comments
-Phil
How long do they run on batteries for?
Depends on the data being displayed. For data like river level that changes very little over the course of a day I'm calculating between 1.5 to 2 years run time. Let me back that up with some data: My bench meter can record the current every .2 seconds and log it to a CSV file on my lab computer. Here are the results from one of my tests pulled into excel and graphed.
The large spikes are the current for moving the stepper, the further the stepper moves the bigger the spike. The small spikes that appear at a regular interval are the propeller waking up from a pin sleep, starting a cog, and firing up the IR receiver circuit to wait for a command. The current profile looks like this:
The average current usage of all this over a week is running around 73uA. To find the run time I take that 73uA and divide it into the ampere hours of my battery bank. The 3AAA battery I’m using has a 1250mA hour rating. 1.250 / .000073 = 17,123 hours that = 713 days or 1.95 years. I know I have over simplified this, but my goal was to get a year run time and I think I’m going to make that.
Thanks Phil and thanks again for all the help!!
Your woodwork doesn't look all that bad and no one is normally going to see the inside.
How are you or did you calibrate these?
Yep I have a calibration table for each gauge face and store the information in a JSON file on the Pi. Here is what the file looks like for the Grafton Flow and Velocity gauge. By storing the calibration settings in a lookup table, I can have a nonlinear gauge like I did for the Grafton River velocity. The JSON file also holds the gauge's address, name, and some data keys I use to lookup the data on the Internet. So if I want to add a new gauge I just have to add its configuration settings to the JSON file.
"Grafton Flo":{ "gaugeIrAddress":5, "CalibrationTable": [[0,0],[20000,15],[620000,614]], "dataSiteCode":"05587450", "dataParCode":"00060", "dataLoc":"daily" }, "Grafton Vel":{ "gaugeIrAddress":6, "CalibrationTable": [[0,15],[1,178],[2,339],[3,499],[6,618]], "dataSiteCode":"05587450", "dataParCode":"00060", "dataLoc":"daily", "dCMethod":"dc_RiverVelocity" },This June wraps up year two of this project and as I now contemplate year 3 goals I thought I would check in with the forum. Year one was the circuit design and firmware of the battery powered gauge. Nothing has changed with the design since then. I have created about a dozen units for testing and they are all working like a champ. I had some concern since I'm using the props internal clock at 20 KHz there would be significant differences in frequency between physical units causing communication issues. This has not been the case, the infrared communication protocol I created has worked very well even with the small differences between prop clock frequencies. The PCB and firmware has been rock solid with easily a year and half run time on batteries. I have several units on the wall in my office that are running on batteries that are almost 2 years old. I’m going to let them run until they fail. I love the Prop 1’s stability even as you push it to the edge of its specs!!
This last year has been nothing but code. As you may recall I use a Raspberry Pi Zero W to fetch the data and send it to the battery powered gauges over Infrared LEDs. I call this Pi Zero my Gauge Data Transmitter. All code that runs on the Pi is open source and available on my GitHub site https://github.com/RuckerGauge. The biggest challenge I faced was how to manage the system. I wanted to provide an easy interface for users to setup the gauge transmitter with their iPhone over bluetooth. That required a ton of learning time for me. I had to write a Node.JS base BLE Peripheral that conformed to Apple’s strict enforcement of the BLE 4.2 security model. Basically if you want to securely connect your iPhone to a BLE peripheral it must adhere to latest BLE 4.2 spec. None of the available Node.JS libraries supported this level of security so I had to write my own. Once that was written I was then able to write a SWIFT app for IOS that allowed my iPhone to manage and setup the Raspberry Pi Zero base Gauge Data Transmitter. I’m currently testing this app and have received approval from Apple to open the testing for up to 10,000 users of my app. That process in its self is an interesting story.
Also last year I have talked with a FCC testing facility and received confirmation that my battery powered gauge will not require FCC testing / certification. This is huge for me as I would like to have the option to market this as both an end user solution as well as white label it for others to slap their logo onto it. Not sure if I will actually do that or not but it is an option. I have also worked with a patent attorney to insure that I’m not infringing on anyone’s patent and got the green light there.
My goal for this coming year June 2019 to June 2020 is to polish everything. I’m going to make several units and get a few out in the public. I have no idea if anyone will even be interested in these gauges. If they are not I will still make them for my family and friends as I enjoy the process so much. My woodworking skills are improving and each gauge I make looks a little better than the previous one. I will upload a few examples of my current work.
If your interested in beta testing this with me, shoot me an eMail to JHRucker@outlook.com.
Given the latest rain/floods on the Mississippi river, do you have new graphs?
Great multifaceted project, thanks for the update and for keeping going with it. I love those walnut enclosures. You know, Chip lives in the middle of walnut orchard and used to have a barn full of cut pieces curing. Near the Sacramento River.
Maybe you explained in another post, but I was wondering how and from where the RPi fetches the river stage data? A USGS real time database or something like that?
Congratulations! Very professional!
Yes I sure do. The three gauge wall hang I have pictured was inspired by the flood we are having here on the Illinois. We live very close to where the Illinois river meets the Mississippi (don't worry we are high and dry 20 miles away) but we do keep our boat there so I have been pretty involved. My son is the harbor master at the local marina in Grafton, IL and I have been helping him prep the marina for the flood. The 3 gauge wall hang pictured in my post shows the current river level, the 24 hour forecast rise or fall in inches and the 3rd gauge shows a 14 day peek forecast. I'm working on another version of that gauge as well.
Yep you guessed it!
The river gauges pull data from two locations:
For current (near real-time) river level, the U.S. Geological Survey (USGS) maintains an API to the gauge data from thousands of river gauges. Almost all the gauges measure gauge height (river level) but some also report flow in CFS, water temperature, rain recorded at gauge, and some gauges even report conductance. Here is a link https://github.com/RuckerGauge/RvrDataFetcher to my Node.Js RvrDataFetcher its README.md has more information on how to find a gauge and access the data.
For forecast data NOAA creates short term and long term river forecast based on flow data from the above U.S. Geological gauges and the 24 hour precipitation forecast. Not all gauges have a forecast associated with them but most gauges in metropolitan areas do have a forecast. I would love to make Chip and Ken a gauge. In fact it would be fun to document the process on this forum. If you don't mind take a look at this map of gauges in the bay area and find a gauge that would be close to something Chip and Ken care about (I would be happy to make two gauges). I just need the gauge IDs (5 character ID). If you think it would be worth it I could make it out of his walnut.
Back to the data source topic. Keep in mind the data doesn't have to be river level data. I have a gauge that shows the solar production of my home's solar panels. It pulls the data from the SunnyBoy Inverter in my basement. I also have gauges that show weather data from IBM's Weather Underground API. So gauge data can literally be sourced from any API you can access over the internet.
The ESP8266 unit does have a low power mode and it could be added to the Parallax's firmware.
Mike
Sorry Mike but I don't think the ESP8266 would be a replacement. It is a WiFi module and the Raspberry Pi Zero W is a complete ARMv6 computer with WiFi and Bluetooth built in. I need the full power of the Raspberry Pi as it servers as a host for my Node.JS based data applications, provides a secure Bluetooth LE connection to my iPhone, and sends the gauge data to my battery powered Propeller V1 based gauges over infrared (with my ir board attached).
If you're thinking I could add the WiFi module to one of my battery powered gauges to replace the infrared communications that is possible. However, you can't efficiently put WiFi adapters to sleep and wake them back up. Based on my experience with ZigBee radios WiFi is a huge power hog and it wold be better to go with a ZigBee or Thread based radio. But that would require FCC certification and some type of cloud based configuration and data service. I have gone down that road with other projects and it is just too expensive.
I think this one on the Sacramento River would be closest to Chip...
USGS 11377100 SACRAMENTO R AB BEND BRIDGE NR RED BLUFF CA
Ken lives very near Lake Tahoe...
USGS 10337000 LAKE TAHOE A TAHOE CITY CA
That lake station is listed as "provisional", whatever that implies. I recall that Ken made a pontoon boat/drone to explore conditions in the Lake, so I do believe he is interested in that sort of thing.
A couple of stations that are of particular interest to me are:
USGS 11162570 SAN GREGORIO C A SAN GREGORIO CA
I installed a turbidity meter there co-located with the USGS bubble gage. A neat setup, a day spent running conduit through a thicket of nettles. This reminds me to check up on it, being managed by sgerc.org. (San Gregorio Environmental Resource Center) . San Gregorio Beach is one of my favorite along the coast, and the San Gregorio General Store across just up the road from the gaging station is a historical landmark, eclectic bookstore and live music on weekends.
USGS 11475560 ELDER C NR BRANSCOMB CA
Elder Creek feeds into the South Fork of the Eel River, and its watershed is completely protected within the University of California Angelo Reserve. (https://ucnrs.org/reserves/angelo-coast-range-reserve/).
Awesome sounds like I have a few gauges to make. Let me zero in on the best data source. Please take a look at each of the links:
Chip's gauge:
NOAA's Site: Gauge ID BDBC1
USGS Site: Gauge Number 11377100
I think the best source for Chip's gauge would be the NOAA site. I can make a tri-gauge that shows current height, 24Hr forecast, and 14 day forecast.
Ken's gauge:
NOAA's Site: Gauge ID THLC1
USGS Site: Gauge Number 10337000
I think the best source for Ken's is the USGS gauge height. Looks like the lake level changes very little so not sure how exciting the gauge will be, but I can make him a neat little desktop gauge.
Your (Tracy's) gauge:
Let's pick one gauge to focus on. How about the Elder Creek gauge, it has height, flow and water temperature data we can work with.
NOAA's Site: Gauge ID ECBC1 (my best guess. No forecast data)
USGS Site: Gauge Number 11475560
I think the best source for your gauge is the USGS data. I can make a Tri-Gauge with Height, Temp, and Flow.
To setup a gauge you will need an iPhone 7 or newer phone. It will be awhile before I port things over to Android. If you don't have an iPhone a newer iPad would work as well.
Let me know what you think.
Wow, that's very generous. The Elder Creek site is part of the NSF Critical Zone Observatory, with data going back to 1967 and earlier. The subsection that they call "Rivendell" is densely instrumented with environmental sensors. There is a database, and I see that it includes the USGS data, but it's kind of hard to explore. A gauge for the USGS data sitting on an easily visible shelf would be great.
https://criticalzone.org/eel/infrastructure/field-area/angelo-coast-range-reserve/
https://criticalzone.org/eel/infrastructure/field-area/rivendell/
Could the gauge include sediment load? The interest has a lot to do with minerals and nutrients and general turbidity entering the river system.
About lakes, granted, not too exiting for a height gauge. Level changes are an integration, seasonal and long term. There is also the Truckee River up there, the only watercourse leaving Lake Tahoe. My sister lives on a bluff on the Lake Michigan shore, and it is at a cyclic high level, last seen around 1986. The bluffs are being eaten away, so it is a big concern for people along the lake, but I think in the short term they are more interested in wind and wave action.
The gauge can absolutely include sediment load. We need a good source for the data. USGS data includes Suspended Sediment but the records stopped being updated after 1975. The Water temperature and discharge are still actively being updated so I can get that data no problem.
In looking at the Berkley database at this link http://sensor.berkeley.edu (login as guest and then click on "Query a Specific Station at Angelo Reserve". I can see station data for Rivendell stations but I don't know what to look for. It looks like the stations that start with Riv are in the right area and several of them are still active. I see stations that give us ERPs (electrical resistance probes) & TDRs (Time Domain Reflectometer), Soil Moisture, Sap stations, and VMS. All kinds of good stuff. I think I would make a Sap gauge to just say I'm monitoring the Sap on a tree in California (if that is what a Sap gauge does) <smile>. If you see a station that has data you care about give me a link to it and I will research it more. It looks like we have to have permission to use this data in a public way so I will contact them and see what they say. I'm not sure if I can get the data in real time as the website is setup for database reporting not streaming. But that may not be a problem I would only need to query their database every 15 minutes or even just once a day depending on the data.
I've been traveling and preoccupied for the past couple of weeks, not much time here on the forum.
I'll contact the guy who handles the IT there at the Angelo, if you haven't already, and see what I can find out about the data access and the current status of things. It is in the nature of University research for projects to come and go at the whim of researchers and funding. However the Angelo is listed as an NSF critical zone, and that means certain powers that be want to track changes over the long term. "How flows the sap, this year, compared with the past?" The equipment has evolved considerably through time. I installed the very first monitoring station there in 1991, and I'm sure they have that data in the archive, along with the very ad hoc QC notes. That system is the one listed first at http://sensor.berkeley.edu as "Angelo Headquarters Stilling Well has 3 gages at the time of this writing. The old OWL logger ...".
It was first off an "OWL" based around a Tandy M102 computer that phoned it's data into a BBS at 300 baud at half past midnight every day and showed its readings to visitors at the HQ building. Level of the Eel River south fork came from a Unidata depth sensor located in an abandoned USGS stilling well, with a beaded cable, and float and weight, that could resolve 1mm in 32 meters. At some point after 1995 I changed that over to a BASIC Stamp 2 "OWL2" with an LCD screen that rotated through readings and stored data on a vDrive. I lost touch with the project sometime around 2005, as they moved to Motes from the EECS dept., more distributed monitoring and better IT, which has evolved into the wide ranging sensors they have now.
The neatest thing for one of your gages would be the stage of the south fork Eel. They mention having a pressure gage there now, but the old beaded cable/encoder would be more accurate.
No problem on the delay. I do have concern that the University's data access will change. They don't seem to have a Web service base REST API like the other providers I have worked with. I can make SQL work (I think) but once I get it all working is it going to start failing as soon as they change something.
So what I was planning on doing was putting together a gauge based on USGS data, that will show gauge height, water temperature, and flow of Elder creek. I thought if you found it useful enough you may be able to convince the Angelo guys or whoever is responsible for data access to work with me. Who knows maybe they have a web service and it is just not documented on the researchers web site. I would love to make gauges that help highlight data they want to make public.
If you do get a chance to talk with someone that can give me access to a Web Service API to the data I would be very happy to work with them.
It would be so cool if that BASIC Stamp 2 was still there uploading data. I would have to make a gauge for that data.
Progress will be a little slow over the next few weeks. The Mississippi and Illinois rivers are finally going down and I will be helping with the cleanup. I will post updates as I move forward.
I think I'll be visiting up at the Angelo this weekend, if the rest of the family is willing, after seeing a friend in Laytonville. I'd like to take a look around, and maybe we'll have time to get up into the Elder Creek watershed (It's quite a hike up and down along the Eel to get to the confluence).
We have to remember that this is California, and it doesn't rain during the summer, so much of the time the water is low. Then, there are winter floods. It almost needs a non-linear scale, logarithmic or square root.
No problem, we can do non-linear. Take a close look at this gauge face I built 4 months ago to represent the 24-hour forecasted change of the Mississippi river. You will find there are 5 scales on each side of 0: first scale) 0" to 1", second scale) 1" to 2", third scale) 2" to 4", fourth scale) 4" to 1', fifth scale) 1' to 7'.
Most of the time (guessing 80% of the time) the Mississippi River (where we live) only changes an inch or less in 24 hours. But during a moderate flood it can change tens of inches and in a major flood it can rise several feet over night. I wanted to show all this but still make the gauge useful for the 80% of the time it only moves 1" or less. On the Raspberry Pi each gauge gets its own calibration table that can support a non-linear scale. I use this table in a lookup function to find the physical location of the stepper, and beam that to the Propeller. The Propeller based circuit simply keeps track of the physical steps from home. The real heavy lifting is done back on the raspberry Pi in Node. So, if I come across a gauge face that my lookup table can’t represent, I can still implement that in Node.JS without any firmware change to the Propeller.
I think the winter floods are still going to fit in my above gauge face. To come up with the scale I made queries against the historical data on the USGS web site. The following screen shot graphs out all the readings for the gauge height of the Elder creek for the past 12 years back to October 1st, 2007. The highest value the gauge ever read was less than 8 feet over gauge level. So, I’m guessing gauge height isn’t telling the whole story here. Maybe as the creek rises the cross section vastly increases to accommodate massive amounts of water flow. Or maybe the velocity of the creek is so fast that is how it can handle the volume. Is the gauge at the top of a waterfall (smile)? Maybe you can get a feel for what is really going on when you make your visit. I can get the flow in cubic feet per second from the same gauge and that is the next face I was going to make.
The following is the link that produced this graph. It takes some time for the USGS computer to render it but that is understandable as it is going back over 12 years of data.
https://nwis.waterdata.usgs.gov/usa/nwis/uv/?cb_00065=on&format=gif_stats&site_no=11475560&period=&begin_date=2007-10-01&end_date=2019-07-12
We did get up to the Angelo Reserve and Elder Creek over the weekend. Elder Creek has cut a deep canyon at the point where the USGS gage is installed. I didn’t have time to clamber down to stream level to look at the profile there, but there is a steep trail (poison oak too). The rock is fairly soft, so it appears it would be difficult to maintain a calibration curve from water level to volume flow.