

What is the Resolution and the standard deviation of values of the smart Pin Adc of P2?
 Christof Eb.
Posts: 1,597
Christof Eb.
Posts: 1,597
Hi,
in the new datasheet for P2 I did not find any information about resolution and signal to noise ratio of the adcs.
Lets assume P2 is running with 200MHz clock frequency and that I want to sample with 100kHz.
1. This should give a resolution of 1/2000, right?
2. But what will be the signal to noise ratio or the standard deviation of a value with gain 1.0?
3. I assume, that this will be different, if *100 Gain is used, what will be the standard deviation there?
I would be thankful for some typical numbers. I know, that I can make them worse with bad ground and analogue design. If you do not have the standart deviation, just please give me some other numbers.
Iwould like to suggest to include such information in the data sheet.
Thanks, Christof
Comments
I'll have a shot. I'm still getting my head around noise myself.
1: In that example: Sinc1 resolution is 2_000 counts per sample. Sinc2 resolution is 4_000_000 counts per sample. And Sinc3 resolution is 8_000_000_000 counts per sample. Smartpin Sinc2 and Sinc3 counters are limited to 134_217_728 (27-bit) - 1 though.
1.5: Effective-number-of-bits (ENOB) is the next factor. Chip has described this based on sample period. But looking it up online, there is a large swath of technical docs about analogue characteristics. I haven't been able to relate the two. The one commonality is they both indicate a negative noise-to-frequency slope where the noise floor rises up as your approach DC.
2: Which means noise floor is set by ENOB in the low frequencies apparently. So, target frequency band matters for answering this.
3: Yep. There is some historical testing by Chip and Vons James (Saucy) and Richard.
Chip and Vons James (Saucy) did most of their effort during the big discussion on the Sinc filters - https://forums.parallax.com/discussion/169298/adc-sampling-breakthrough
Here's a copy of Richard's effort - https://forums.parallax.com/discussion/comment/1499361/#Comment_1499361
Thank you very much, envanh!
Gives some good reading . :-)
I would like to see some practical numbers for P2, Rev. C depending from the gain factors.
Beyond my skill level sorry.
Hi evanh,
as you said, you are interested in this topic yourself, I can suggest some simplified approach, which might be helpful.
In stead of using a sine test signal, you could just build a voltage divider with two (2k2?) resistors or a potentiometer to get 1.65V. I would add a C=100nF at this voltage against GND.
You could then do the following:
Set up a certain clock frequency (200MHz), and
a certain sample rate (100kHz), which together gives the mathematical resolution of 2000 values.
Set up a gain factor =1 (later 100?)
Switch off the (averaging) sync filters.
Write a little program, that sends you 500 measured adc-values to your pc.
Use Excel or some other spreadsheet program to calculate average and standard deviation of these adc-values.
For this large number 500 of samples this "standard deviation" https://en.wikipedia.org/wiki/Standard_deviation is the same as the "standard error" and it is the same as the "RMS-Error".
You can also let Excel draw the histogram of values, which gives a valuable sense of the scatter of results.
Richard just did the same. However instead of a constant voltage, he used a sine voltage. So he had to fit an ideal sine into the measured adc-values, calculate the difference of each value to the sine and calculate the standard error RMS-error=4.17 samples.
(When I was using P1, the most critical voltage has been 1.65V. At this voltage the comparator of the sigma delta converter is always in the midrange, where the "electrical noise" inside the processor decides.)
The reason to switch of the sync filters at least for first results is, that they do averaging and will therefore reduce the amplitude of a high frequency signal. (I have to admit, that I do not see the big advantage of these sync filters over just using a longer sigma delta period. You seem to get almost the same information but more often? Very many more data points with very little or no more information?)
I have been working with statistics of test results for many years. Statistical methods seem to be a little bit obscure some times for many people. My opinion is, that you can do nothing wrong, as long as you exactly tell, what you have done to get the basic data and then to derive the result numbers. The more difficult part is then the conclusions that can be drawn from that numbers for some different case.
Different professions do use some different wording. So electrical engineers speak of noise, while some others speak of scatter of results.
If you like, you could post these 500 values, one number per line, in a text file for known clock frequency, sample rate, switched off sync filters and known gain factor. (As said, gain=1 and gain=100 seem to be very interesting) I could then post the spreadsheet.
@Parallax - are you there?
Is there any info about ENOB for 100kHz sample frequency, no filters, for P2, Rev C, for gain=1 and gain=100?
Thanks for some numbers or links!
Edit:
Historic Data, Seems to have been taken for RevB(?) RevA (thanks, EVANH) and for gain=1. :
https://forums.parallax.com/discussion/169602/characterizing-p2-eval-analog-performance
ENOB = 10.5 for 2048 samples period @ 240MHz. RJSM used his own definition for ENOB
Standard deviation = 2,5mV from 3300mV ( in the txt file)
https://forums.parallax.com/discussion/download/125214/P2-EVAL-ENOB.jpg
100kHz sample frequency is 2000 clocks @200MHz. The docs say you could expect 12 ENOB but that's a theoretical number. I got something around 12 "almost stable" bits at 22kHz sample frequency (8192 clocks @180MHz) with my servo controller project. "Almost stable" means the LSB is stable if the voltage is exactly centered in a code window and dithering otherwise. That was in a noisy environment with switching IGBTs at high voltage nearby. So if you subtract 2 bits as safety margin from the theoretical values you should get at least 10 ENOB at 100kHz. That should meet your requirement of 0.1% accuracy. With a well filtered supply voltage and no noise sources nearby. That's for gain=1. I have no idea what to expect at gain=100.
Thanks, so for 8192 samples, 12 bit "almost stable", that is the same as ENOB in the graph:
https://forums.parallax.com/discussion/download/125214/P2-EVAL-ENOB.jpg
So I assume Rev C has about the same performance as measured then (RevB?) RevA.
Nobody tried this with gain=100?
Perhaps this type of graph is useful for others too.
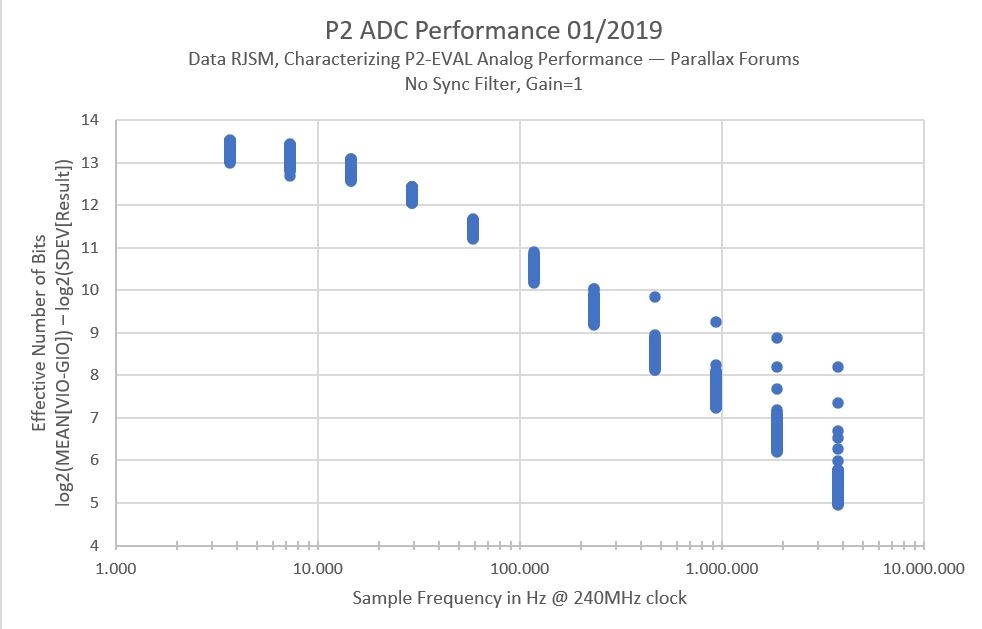
It just shows the data from https://forums.parallax.com/discussion/169602/characterizing-p2-eval-analog-performance .txt file in another way.
Still hoping for some info about other gain values.
RevA silicon from end of 2018. RevB silicon from end of 2019. So that was revA. It makes sense too because Richard had used the Sinc1 smartpin mode only. Sinc2/3 wasn't added until revB silicon so he didn't have the option.
EDIT: Sinc1 (internal bitclock) mode is
%01111 AND !Y[0] = P_COUNT_HIGHSSinc1 (external bitclock) mode is
%01100 = P_REG_UP(A input is bitclock, B input is bitstream)Sinc1 is what you're calling OFF. Not actually off at all. Sinc1 has the most averaging effect by the nature of needing longer sample period. It's the lowest performing filter available.
A true off is the raw bitstream, which can in fact be captured if really desired. The streamer can record the bitstream (internal ADC only) to hubRAM indefinitely. Or there is a smartpin mode (can be used for both internal and external ADCs) for a cog to read in 32 bits at a time.
When I say "bitstream", I'm referring to PDM (pulse density modulation) serial data. This is normally sent over simplified SPI using just two pins (CLK and DATA). The ADC is configless.
Many of the regular settings in PCM ADCs pertain to PCM sampling parameters. Whereas with external PDM ADCs, such config all moves to the receiving hardware (eg: Sinc counters/decimators) so there isn't much in the modulating ADC that could be configurable. There is analogue factors like channel select, gain and offset but those are a whole other level of config that needs said analogue hardware to achieve. Not an option over PDM transport.
One config that does exist is the PDM transport can have frequency range for its clocking. This is done via use of ADC parts that slave to a PDM master clock instead of generating their own. This affects the internal performance of the ADC as it's internally synchronous to its PDM clock. Lossless all the way.
The internal ADCs in the Prop2 don't need a specific PDM clock signal since they run at sysclock frequency and stay synchronous to sysclock. So they just have the bitstream appearing on IN (a new bit on each sysclock tick).
Okay, written myself a new bulk recording program with FlexC. Here's a dump of pin group P40..47, in eight columns:
Gain = 100
Sinc3 filter
Sysclock frequency = 20 MHz
Sample rate = 40 kHz (500 ticks per decimation)
Contiguous sampling of input - not calibrated
All pins floating
10 ms pause for ADC modulators to warm up
First 10 sample lines deleted
EDIT: Added the source code
EDIT2: Updated program and data to avoid a potential ordering bug in the formatted text
Updated the column labels to be auto-generated with changing ADCPIN base.
And a couple more examples of gain = 1 and gain = 100 with wires dangling off P8 and P9. The 50 Hz mains frequency shows up as a result.
Hi evanh, great!
Just a question: What did you connect to the input pin?
I had suggested a voltage divider consisting of 2 resistors 2k2 between +3.3V and GND plus a capacitor 100nF connected to GND. Middle of the divider connected to the input pin and to the second side of the capacitor. Voltage 1.65V at the pin.
Edit: Oh, it says "all pins floating". So they act as antenna.
So we don't measure the quality of the adc but the quality of the antenna? The input pins have to be tied to a fixed voltage!
And only 20MHz with 40kHz sampling, so <9 bits resolution.
This is with sync3 filter. As said, I would start with no sync2 and no sync3 filter. "Simple things first."
Edit2: Looking at the code with all that assembler. Is it really that complicated to use an adc?????
I can see
The Eval board has a decent amount of high quality capacitance in it's layout of the signal tracks. That's why only the ones with dangling wires has any signal.
Humour me.
For Sinc3 mode, yes. Others, not so much.
Sorry here, my English is unfortunately not good enough to understand this.
My problem with sync2 or sync3 filter is, that I do not really understand them. They do heavy averaging. So they will heavily cut bandwidth. But how many dB at what frequency?
Edit: I don't know if my explanation, why the input pin has to be tied to a fixed voltage has been understandable?
It means I feel I've done something worth following through on. Try it out.
BTW: The averaging is much smaller with Sinc3 vs Sinc1.
Oh, probably an important detail for your analysis: In the data files above, numerically, full range is 125,000,000.
Here's an example using gain = 3 with all the pins tied to Vdd: It produces the expected solid flat line full-scale of 125e6.
EDIT: And same again but at gain = 1.
EDIT2: Added photo of Eval board with P40 group bridged-out to Vdd.
So for the version inputs tied to 3.3V, gain=1, 10MHz clock rate, sample rate with 20kHz, Sync3 averaging filter (whatever this is/does) we get at P40:
Average 105.256.589,26
Standard deviation 15.873,81
Bits Average 26,64933531
Bits std dev 13,9543611
ENOB 12,69497421
It is strange to me, that instead of 125e6, only about 105e6 is reached.
I have used ENOB= LOG( average; 2 ) - LOG ( Standard_deviation ; 2 ) here.
This ENOB of 12,7 is then somewhat like best case for very heavy filtering and gain=1 then.
I would be interested in the version with voltage divider - then you can use the gain factor- and using only Sync1 filter.
That's because gain = 1 is a span of about 5.0 Volts with the centre value (62.5e6) at Vdd/2 (1.65 V).
Sinc1 uses a separate smartpin mode altogether. In fact the specific mode wasn't even listed as intended for this use. I'll need to think about its details before coding it ...
Oh, I used 10 MHz sysclock so therefore PCM stored samples were 20 kHz sample rate. That's the "20k" in the filename. EDIT: I might try to add config details as a header at the start of the data file.
When you say 500 samples, do you mean you only used a block of 500 samples (25 ms @ 20 kHz) from my data file? Why not use more?
I used all values of a column. I have updated the post.
Idea:
These values in the files, are they consecutive samples without gaps?
If this was true, a completely separate measurement could be done, to learn more about this Sync3 filter. A cog could output a square wave 0...3.3V as an input signal for an adc pin. You could then see, how fast the filtered adc value can follow. Impulse response. To have 4 complete cycles in the 10000 samples, the frequency of the square wave should be 20kHz/10000*4 = 8 Hz.
This has nothing to do with the noise measurement, it will only show how fast the adc-value will be able to follow. Normal sigma delta (Sinc1) can follow 100% within one sampling cycle.
We did those tests in the early days, disturbance settle time is three (an additional two) decimations. I can see you already suspected this. It's the same response as initial conditions, which is why contiguous operation is a significant factor in Sinc2/3 uses.
I'm not clear on how that fits with filtering parameters though. My own understanding of filters is poor.
Thanks. I've duplicated reproduced your numbers now. I wasn't even sure about how to produce a standard deviation using a spreadsheet function. Having both the data set and results to compare definitely got me sorted.
Thanks again.
Lol, ENOB = 0.6 when toggling the output.
EDIT: Here's a selection Sinc1, 2 and 3 with square wave driven on the eight ADC pins. I've added the header info now. And also have easier re-config with all the parameters grouped together.
PS: The ADC recording routines both look and are more complicated than need be. I've merged them together as well as choosing the more complicated solutions since I wanted to retain all the resolution I could for future testing.
Here's a better commented source code for the Sinc1/2 combined decimation (sampling) routine:
.loop1
        mov pb, #0              ' channel index

        rep @.chrend, #8            ' eight channels

        alts    pb, #ADCPIN         ' non-incrementing index [ADCPIN..ADCPIN+7]
        rdpin   pa, #0-0            ' read decimation data from smartpin

    if_c    alts    pb, #.diff2         ' non-incrementing index [diff2..diff2+7]
    if_c    sub pa, 0-0             ' differentiate (difference with prior decimation)

        altd    pb, .altinc         ' incrementing index [diff2..diff2+7]
    if_c    add 0-0, pa             ' store decimation (adjust prior data by difference)

    if_c    zerox   pa, #26             ' truncate to match 27-bit hardware accumulators

        wflong  pa              ' write to hubRAM
.chrend

        waitse1                 ' wait for next decimation event
        jnfbw   #.loop1             ' loop until FIFO wrapping event, don't want remaining FIFO data
The conditional execution lines are for Sinc2 "Filtering" mode. This executes like the Sinc3 Filtering mode but with one less "diff" register. The one mode not catered for here is the Sinc2 "Sampling" mode, which is simpler to use but chops off the lower noisy bits that I'm still keen to experiment with.
EDIT: Tidied up the source some more. All the parameters are now at the start of the source code in the first "enum".