

Thoughts and an Experiment about Graphical Programming
 Christof Eb.
Posts: 1,597
Christof Eb.
Posts: 1,597
Hi,
perhaps someone is interested to join into some discussion about graphical programming?
We have had such discussion in the past here and now I can share a little simple experiment.
I am sort of a "visually thinking guy", love for example topographic maps and like the concept of schematics. Also I like the concept of PureData for visual programming. All of them can give a fast overview very quickly.
On the other hand in my opinion any program language can describe a in detail sequence of steps in a much more compact way than a flow diagram.
So let me state some basic frame for my approach:
1. Use a programming language for the details
2. Use graphical representation for the big picture
3. Do not use "Sequence of operations" as lines like a flow chart, but use "flow of data" as lines like PureData
4. As a screen is never big enough, a concept for zooming in and out is needed. Modern good mapping programs have a concept of importance and select visible items corresponding to the zoom level. Also they use different symbols for the same thing in different zoom levels.
5. Like in PureData, the running code can insert life data into the graphical representation. So the picture becomes a user interface.
Some elements of the concepts of my experiment:
1. A new type of variable, which also has a time-tag. The idea is to use this, to decide which code has to run.
2. ASCII text is used together with VT control codes for cursor control.
3. A "node" has 3 lines: a) input variables, b) the code, c) output variables with some code
4. Use named global variables to hold data streaming from one node to several nodes.
5. The only database is a Forth source file. This means that the contents can be compiled with the normal compiler. The same file contains position information where to place the nodes. Or/and where to place the life data. To just view the graphics the file is interpreted by a special viewer.
6. Code of a node can be a sequence of any Forth words.
7. Instead of zooming there is the possibility to select different pages. (Much simpler)
8. Flow of data is always from top to bottom or from left to right.
9. Only selected global variables are drawn as lines.
10. All nodes sit in a big loop, if they are normal Forth words they are executed every cycle. Special new words can be defined, which can decide if they have to execute. Idea is to use the time-tags here. (???)
11. The loop is executed with "pause - type" multitasking in background, so the system remains fully accessible in parallel. You can alter parameters for example.
12. Special new store operators: t! store with time-tag. dt! store with time tag, if the new value is different from the previous.
13. I have the convention to use name* with a star at the end to indicate variables with time tags.
Well sorry, this is done with Forth. Reason is that it is very much simpler to do this with Forth. And Forth can recompile the test file within xx milliseconds.
As little example a LED shines together with the ambiente light onto a LDR. A program shall measure brightness, use a PI-regulator and a PWM output to always have the same brightness. Additionally there is some software counter, which gives an indication of the speed of the loop.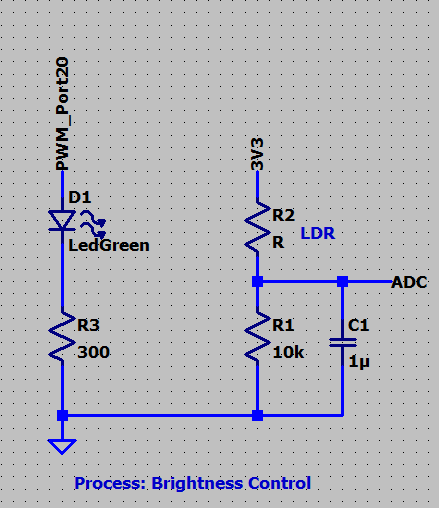
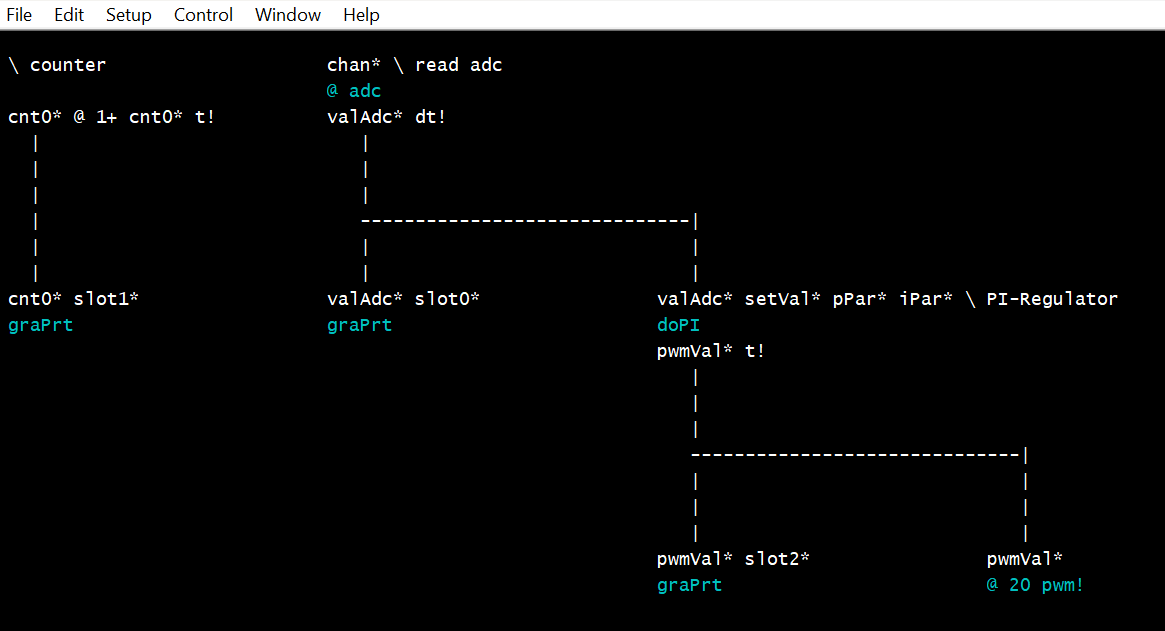
Backslash indicates a comment. doPI is the PI-Regulator. graPrt does the life data output. So when running, this page looks like this: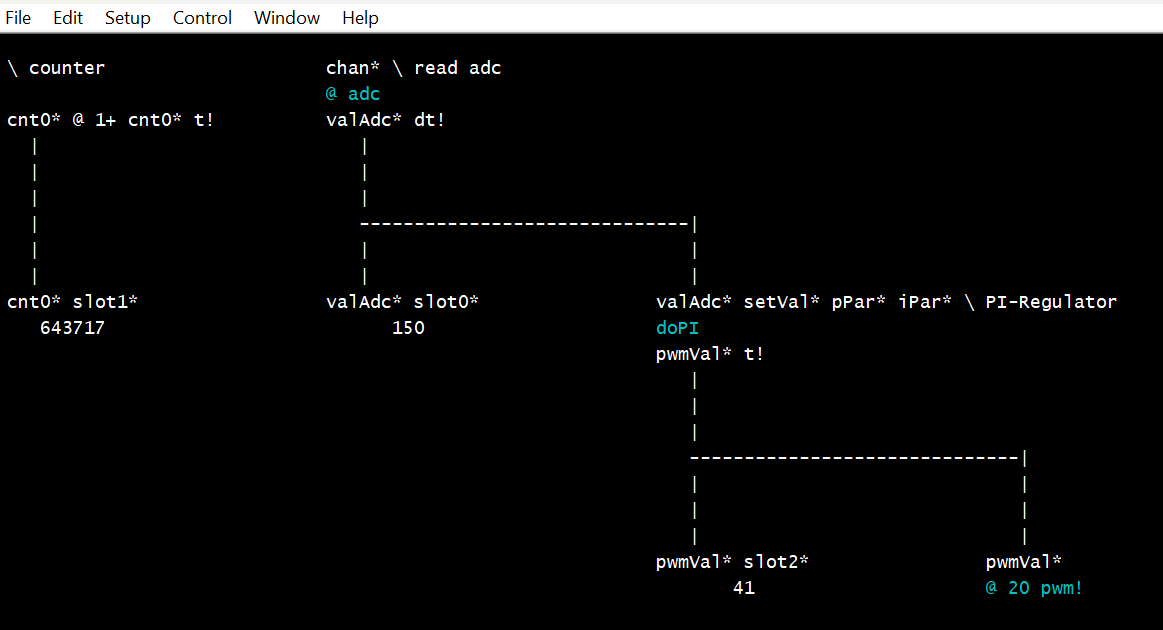
At the moment there is only a viewer, not graphical editor. The graphical interpreter is also rather basic.
An experiment.
Comments? Suggestions?
Christof
Comments
This is interesting ...
but visual programming is definitely not my cup of tea. I tried that, well, sort of, many years ago with then Cypress brand IDE. While I liked the concept of building blocks and then configurations for them, in real use it soon became a nuisance to me. i just couldn't get used to it and abandoned the IDE and the chip family entirely ( tried to get back to them as the chip's feature set was of interest to me but was put away once more).
I too like to see things, work on the idea in pictures, schematics as it's more synthetic and natural to me but my tools of choice are very old fashioned...just pen (a pencil, to be exact) and paper. The real ones. I "waste" a lot of that stuff but simply like to not only see the picture but to draw it as well. It's part of the fun.
I know this is not optimal in general but it's just my way of doing things. Odd, I know. I won't fight my nature.
Maciek
For the last 15 years of my career, I taught myself to program in LabView, from National Instruments. I was testing products for Electromagnetic Compatibility and the customers sometimes didn't provide a test harness to get the product running. LabView programming was very easy, thanks to the very thoughtful IDE. The pallettes of functions that made up the language were very quick to navigate and hovering over anything gave you a pop-up help. As a hardware engineer, I developed some very complicated programs - much more advanced than I would have attempted in a text based environment. Incremental design on a working prototype suited my 'no specification' way of working. I really enjoyed programming in LabView - not something I could say about any text based language.
To encourage students, LabView has been extended to FPGA programming and to provide interaction with Arduino and other microcontrollers. It doesn't allow you to program Arduino in LabView, though.
The full LabView IDE is available for non-commercial use for free, so I would encourage you to dip into it and start talking to your Propeller with it. It has many of the visual features you mention and experimentation might lead you to a way of using LabView for what you want. At the very least, you would gain a desktop tool with which to control Propeller based objects. A really powerful system, which not many makers are aware of and extendable by the user - you could have many palettes of 'P2 functions' to support what you were doing. These would be wired together to show data flow within the IDE, just like PureData on steroids.
Starting to program a propeller in SPIN and PASM, I've found, is slow work. I don't agree that the P2 is a RISC machine! The documentation is now quite good - especially @Wuerfel_21 's website. BUT take any PASM instruction - is it to be conditional? Is the destination and or source to be modified? Does it set any flags? What addressing mode is best? It's not at all like the simple, small Z80 instruction set that I programmed when I was in my 20's! What I'm getting at, is would the newcomer benefit from a programming editor that you didn't need to open reference documents to use - like LabView? Instructions selected from pallettes with headings such as Maths, Logic, Looping, Conditionals and so on, together with submenus of options the instruction takes. It would have to be done well, to save a programmer time and not be irritating to use.
Anyway - just some 'graphical' thoughts I had - cheers, Bob
Thanks @Maciek and @bob_g4bby for the feedback.
I have not tried LabView but I am aware, that it does exist. It also has the concept of flow of data as lines between nodes.
For a measurement or test system this is the right way, I think. Like audio processing and I could imagine, that it should also make sense for a radio receiver?
For my last projects, the knitting machines and also the embroidery controller, this type of visualisation and of software organisation is not strikingly helpful.
In summer I have some tomatoes growing and monitor their demand of water depending from sun intensity, temperature and humidity of the air. Also the level in a water tank is monitored. For this the graphics should include a picture of the hardware setup for life information.
Actually viewing of history of data in diagrams are more interesting though.
I totally agree, that this would be helpful. My Forth editor is therefore going into these directions:

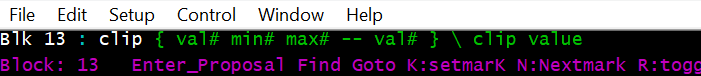
If you start to type a word, here "gra", in a line on top of the screen, knows words with these start are displayed.
If you press ^W then the first line of a word-definition or the line in the forth glossary is shown.
I have now ported ueForth alias ESP32Forth to pico2W. I needed to find a fast way for colored printing of word categories to port my editor, as I don't know how to bring an additional datafield into the dictionary. This method could also be used to offer words in the editor by categories, like you have organised your Taqoz glossary. (((I never got to like the concept of vocabularies, they might be helpful for the speed of a compiler, but they are not -in my opinion- for the programmer.)))
Cheers Christof
I did in fact make a software defined short wave radio receiver in LabView. It works very well - very good audio. The radio frequency hardware I used emulated a USB soundcard, delivering a 96K stereo stream of received signals. This equated to a 96kHz chunk of the SW band, to be displayed in a panadapter and also filtered and demodulated by the PC to the speakers. I could receive anywhere in the 500kHz to 30MHz spectrum - and it didn't require a great deal of processing power on a modern PC.
OK on the garden monitoring. LabView would make the graphs and meters for you and you would be surprised how simple they are to program. You can communicate with the remote sensors by serial port, bluetooth , tcp etc it's all available. There are hundreds of examples supplied, on which to base your application and plenty of YouTube tutorials out there.
Perhaps, @bob_g4bby, there's an opportunity to start a thread on using LabView as a computer interface to an IO subsystem use the Propeller (1 or 2) for control. I would love to see that, and I think it would be something very useful to students.
Hm, yes that looks nice!
Is it possible to use Forth as protocol via serial? Labview would ask "12 adc ." and directly get back the result from channel 12?
@JonnyMac , a LabView thread sounds like a good idea. Start with an introduction on what LabView community edition is and where to find it, then post two or three very simple LabView / SPIN programs to tempt folks to have a go, say:-
1. Listening to a propeller over the USB serial link and accumulating analogue input values on a chart
2. Turning propeller outputs on and off by means of buttons on the PC
3. Controlling an analogue output from a control knob in LabView, and on-off control with a toggle switch
Best to keep the USB serial comms in ASCII to start with - that way folks can check the SPIN program is flashed and working with a terminal program, before introducing the LabView side of it.
@"Christof Eb." yes, it's possible for LabView to send and receive from the Taqoz command line. You make LabView wait for the Taqoz prompt before sending another command line, to keep both in sync. You can have LabView upload a forth program, run that and converse with the program too. Keeping in sync takes a little care - say if someone pushes the propeller reset button or the comms link goes down etc.
“Flow of data” does sound like Labview to me…
Found a thread from a few years ago …
https://forums.parallax.com/discussion/173484/grideye-i2c-thermal-camera-now-connected-to-labview
Excellent ideas. Looking forward to learning from you experience with LabView.
It's interesting, that now our conversation has completely shifted from a programming a microcontroller question to using a commercial product for life visualisation. In the example the path of data is not even visible anymore.
So benefit of graphical programming seems to be limited to only a niche of applications. Coming from PureData perhaps this niche can be defined like this?
1. The programmer is the user, he will often modify the program to get other results from the same or similar data.
2. The main goal of the program is to handle life streams of data.
If I look at this, Spreadsheets seem to be the most often used method to achieve the first part. (There once was an interface between P1 and Excel)