@macca
1. I update MacOS to 26.2 and the Multi-Line selection of text is still not working.
2. Do you find the issue with complex structs I reported in #869
@wummi said:
@macca
1. I update MacOS to 26.2 and the Multi-Line selection of text is still not working.
2. Do you find the issue with complex structs I reported in #869
Yes, I found and fixed the issue with your complex structure, I'm going to do a release later today that should also fix the text selection issue (hopefully, can't verify myself).
Apologies if this is already raised. With Spin Tools IDE 0.50.0, I get
when hovering over .sine1, .sine2, .sine3 labels in column one, but not when hovering over label SINE. Here's my code:-
DAT                                                             { PASM2 code }

                org

SINE
' Fill BUFFER with an i-q sinewave - triggered by ATN
                waitatn                                         ' wait for the go-ahead
                getct _cyclestart                               ' mark the start time
                rdlong ptrb,        ptra[BUFFERPTR]             ' set ptrb to point to BUFFER
                push                ptrb
                mov _sigbuffsize,   ##sigbuffsize
                sub _sigbuffsize,   #1
                shl _sigbuffsize,   #3
                add ptrb,           _sigbuffsize                ' ptrb points to last sample in the BUFFER
                rdlong _real,       ptrb++
                rdlong _imag,       ptrb
                mov _sampleangle,   ##binangle
                mov _binangle,      _sampleangle
                pop                 ptrb
                mov _sigbuffsize,   ##sigbuffsize-4             ' make allowance for preload
                wrfast #0,          ptrb                        ' set up FIFO for writing to BUFFER

                rep @.sine1,        #4                          ' preload the cordic engine
                 setq _imag                                     ' for 4 samples
                 qrotate _real,     _binangle                   ' 4 x 14 = 56, the cordic processing time
                 add _binangle,     _sampleangle
                 waitx #6                                       ' pad to be a 14 cycle loop
.sine1
                rep @.sine2,        _sigbuffsize                ' this is a 14 cycle loop
                 getqx              _realresult                 ' read back result from cordic
                 getqy              _imagresult
                 wflong _realresult                             ' write real result into BUFFER
                 wflong _imagresult                             ' write imag result into BUFFER
                 setq _imag                                     ' send another rotate to cordic
                 qrotate _real,     _binangle
                 add _binangle,     _sampleangle                ' prepare angle for next sample
.sine2
                rep @.sine3,        #4                          ' read the last 4 results out
                 getqx              _realresult
                 getqy              _imagresult
                 wflong _realresult                             ' write real result into BUFFER
                 wflong _imagresult                             ' write imag result into BUFFER
.sine3
                getct _cycles
                sub _cycles,        _cyclestart                 ' mark the finish and calculate
                debug(UDEC_LONG(_cycles))                       ' the execution time (18456 cycles)
                jmp                 #SINE                      ' and go wait for another cycle via a relative jump
@bob_g4bby said:
Apologies if this is already raised. With Spin Tools IDE 0.50.0, I get
when hovering over .sine1, .sine2, .sine3 labels in column one, but not when hovering over label SINE. Here's my code:-
This release updates the SWT library to the latest Eclipse 4.38 release that should fix the MacOS text selection issue.
Some bugfixes, including the complex structure example posted by @wummi, the mouse hover issue above and the parameters range check on some PASM instructions.
Added font selection for the file browser, objects tree and overview panels (all shares the same preference), in Preferences -> General -> Font, the default should be the OS theme default.
For MacOS users, I have updated the Github runners to MacOS-15 becase the previous x86_64 version was deprecated, and in few months the x86_64 runners will be dropped so I won't be able to produce x86_64 Mac builds, hope this doesn't cause any problem.
Other changes:
Update to Eclipse SWT 2025-12 (4.38)
Fixed long-align check on structure members
Added nested structure members suggestions
Fixed structure size update and circular references
Thank you, Marco. The outline is much easier for me to read using Consolas and a slightly bigger size.
A niggly thing... It would be nice if there were more contrast between the icon colors in the object tree. Would it be possible to use the folder icon colors from Propeller Tool? I poked around your GitHub repository and found that those icons are 16x16 PNGs. In the spirit of imagining you saying, "Help me help you" (great line from the movie, Jerry Maguire), I downloaded the object tree icons and made versions that use Propeller Tool colors. They're a bit simpler with less shading, but I think this will help the contrast so that identifying local versus library files will be easier.
Thanks for considering, and thanks, again, for the update. I'm sure I speak for of a lot of forum members when I say that we sincerely appreciate everything you're doing with Spin Tools IDE, and being open to user requests.
@JonnyMac said:
A niggly thing... It would be nice if there were more contrast between the icon colors in the object tree. Would it be possible to use the folder icon colors from Propeller Tool? I poked around your GitHub repository and found that those icons are 16x16 PNGs. In the spirit of imagining you saying, "Help me help you" (great line from the movie, Jerry Maguire), I downloaded the object tree icons and made versions that use Propeller Tool colors. They're a bit simpler with less shading, but I think this will help the contrast so that identifying local versus library files will be easier.
I have added your icons, seems good to me:
I'll use them in the object tree only, the file browser still uses the current icons to be consistent. Maybe it would be good to better highlight the spin files, however I would like to keep the color gradient style.
Just for info, I'm using the Fugue Icons from https://p.yusukekamiyamane.com/ there is also the PSD source, however it doesn't import correctly with Gimp (even the latest version 3.x has problems).
Thanks for considering, and thanks, again, for the update. I'm sure I speak for of a lot of forum members when I say that we sincerely appreciate everything you're doing with Spin Tools IDE, and being open to user requests.
No problem -- it's a visual thing for me. Here's an example where better contrast would be helpful.
A bit of a chuckle... in that same post I was going to ask if you could show the file location by hovering over an element in the object tree -- but it's already there!
I've started using spin tools a couple weeks ago and it's great!
One little thing, then using debug scope, my scope screen doesn't show any data until it seems like the first whole line of data is captured...
This is the example in spin2 document, and it does it also...
Noticed some things when trying to get this raycast code to compile with FlexProp just now... Haven't done that in a while, used to work...
Gives me a strong warning about a jatn spriteret because should be jatn #spriteret
Also doesn't like if_b debug ("Hit!",udec(x)) Don't know why...
But, probably a more real issue is several setq2 #SpriteListSize*SpriteListLongs*4 that should be setq2 ##SpriteListSize*SpriteListLongs*4
Ooops, actually, that #4 shouldn't be there... That's a bad bug...
Kind of surprised code works at all with these errors in it...
On the toolbar... I've never been able to figure out the "annotation" and "edit location" buttons. With bookmarks in place now, I'd like to see the "annotation" or "edit location" buttons used to more between bookmarks (the other set can be removed).
Something that always catches me out is the Tab key not replacing a selection (other keys do). I looked closely and see that when pressing Tab with a selection, it causes the cursor to move to the right side of the selection (if it's not already there).
@Rayman said:
I do like the "View Character Chart..." feature of Prop Tool.
Start that up a lot just to use that...
AFAIK, the Character Chart shows the Parallax font or maybe better the font in the P1 rom.
The Parallax font can be used in Spin Tools, although is not the default, so maybe a more generic font viewer is more appropriate, it is not that easy with all the UTF-8 characters extensions, etc. also the OS should have an applet of some kind to see all fonts. I have to think about that.
@Rayman said:
Noticed some things when trying to get this raycast code to compile with FlexProp just now... Haven't done that in a while, used to work...
Not sure you have posted in the right thread...
Also doesn't like if_b debug ("Hit!",udec(x)) Don't know why...
The conditional in the debug statements was introduced in PNut v50, maybe it wasn't yet implemented. Beware that the condition actually generates a skip instruction in addition to the debug instruction.
But, probably a more real issue is several setq2 #SpriteListSize*SpriteListLongs*4 that should be setq2 ##SpriteListSize*SpriteListLongs*4
That's an issue in Spin Tools, another missing limit check...
@JonnyMac said:
On the toolbar... I've never been able to figure out the "annotation" and "edit location" buttons. With bookmarks in place now, I'd like to see the "annotation" or "edit location" buttons used to more between bookmarks (the other set can be removed).
The Next/Previous Annotation buttons are used to quickly navigate though errors and warnings without the need to scroll the source or click on the bar at the right of the editor, errors take priority, so if you have a source with some errors, the buttons navigate through all errors, once fixed they navigate through warnings if any.
The Previous/Next Edit Location buttons should work as a sort of breadcrumb to navigate through code, the implementation may be a bit flaky, but so far it works (at least for me).
As an example, if you go to a bookmark, the previous edit location button should move back to the original location, without the need to add a temporary bookmark or remember where you were.
Same if you CTRL+click on a method definition, the previous edit location moves back to the original location.
The next edit location moves again to the bookmark or method definition, the location is kept until another event resets the "forward history", like clicking another bookmark.
Something that always catches me out is the Tab key not replacing a selection (other keys do). I looked closely and see that when pressing Tab with a selection, it causes the cursor to move to the right side of the selection (if it's not already there).
Maybe because the TAB is used to indent the block. I see that if you select the space before a statement, then the ident doesn't work. It works if you select the whole line.
I'll see if I can fix it.
Implemented the last two missing debug windows SPECTRO and MIDI, now it should be feature complete.
Implemented an initial support to open files from OS files associations.
On Linux, the association should be installed with the ./spinide --install command along with the desktop launcher.
On Windows, the install method is not yet implemented, it should work by right-clicking on the .spin/.spin2 files and select Open With... and manually browse to the spinide.exe.
On MacOS, I don't know if it works (sorry, my testing on MacOS is very limited), it certainly needs some more implementations but I think most needs an actual executable instead of a shell script, with all the signature issues this involves.
Also implemented drag and drop files to the editor, if you have Spin Tools IDE open, drag a source file from a File Exporer (or the corresponding applet on your OS) and drop to the editor area to open it.
Other changes:
Replaced object browser icons (thanks to @JonnyMac )
Scope debug window is working properly for me now... Before it would not display any data untill a whole window of data was collected, thus taking a while... Now it starts tracing data immediately, like in Pnut...
Thanks!
Mike
@bob_g4bby said:
When running the attached demo in debug with 0.52.0, I notice that the scope window is very much slower than in 0.51.0
I see, seems that the fix for the scope draw had an unexpected effect on Windows, I don't notice any slowness on Linux but on Windows it is really too slow.
I'll try to find an alternative.


Comments
@macca
1. I update MacOS to 26.2 and the Multi-Line selection of text is still not working.
2. Do you find the issue with complex structs I reported in #869
Yes, I found and fixed the issue with your complex structure, I'm going to do a release later today that should also fix the text selection issue (hopefully, can't verify myself).
Apologies if this is already raised. With Spin Tools IDE 0.50.0, I get
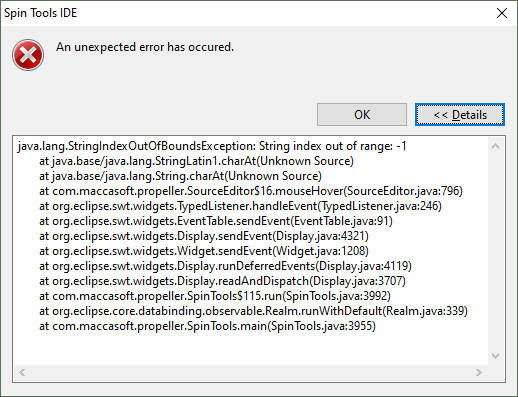
when hovering over .sine1, .sine2, .sine3 labels in column one, but not when hovering over label SINE. Here's my code:-
DAT { PASM2 code } org SINE ' Fill BUFFER with an i-q sinewave - triggered by ATN waitatn ' wait for the go-ahead getct _cyclestart ' mark the start time rdlong ptrb, ptra[BUFFERPTR] ' set ptrb to point to BUFFER push ptrb mov _sigbuffsize, ##sigbuffsize sub _sigbuffsize, #1 shl _sigbuffsize, #3 add ptrb, _sigbuffsize ' ptrb points to last sample in the BUFFER rdlong _real, ptrb++ rdlong _imag, ptrb mov _sampleangle, ##binangle mov _binangle, _sampleangle pop ptrb mov _sigbuffsize, ##sigbuffsize-4 ' make allowance for preload wrfast #0, ptrb ' set up FIFO for writing to BUFFER rep @.sine1, #4 ' preload the cordic engine setq _imag ' for 4 samples qrotate _real, _binangle ' 4 x 14 = 56, the cordic processing time add _binangle, _sampleangle waitx #6 ' pad to be a 14 cycle loop .sine1 rep @.sine2, _sigbuffsize ' this is a 14 cycle loop getqx _realresult ' read back result from cordic getqy _imagresult wflong _realresult ' write real result into BUFFER wflong _imagresult ' write imag result into BUFFER setq _imag ' send another rotate to cordic qrotate _real, _binangle add _binangle, _sampleangle ' prepare angle for next sample .sine2 rep @.sine3, #4 ' read the last 4 results out getqx _realresult getqy _imagresult wflong _realresult ' write real result into BUFFER wflong _imagresult ' write imag result into BUFFER .sine3 getct _cycles sub _cycles, _cyclestart ' mark the finish and calculate debug(UDEC_LONG(_cycles)) ' the execution time (18456 cycles) jmp #SINE ' and go wait for another cycle via a relative jumpEnjoying using the IDE, however, Bob
Will look at it.
Released version 0.51.0
This release updates the SWT library to the latest Eclipse 4.38 release that should fix the MacOS text selection issue.
Some bugfixes, including the complex structure example posted by @wummi, the mouse hover issue above and the parameters range check on some PASM instructions.
Added font selection for the file browser, objects tree and overview panels (all shares the same preference), in Preferences -> General -> Font, the default should be the OS theme default.
For MacOS users, I have updated the Github runners to MacOS-15 becase the previous x86_64 version was deprecated, and in few months the x86_64 runners will be dropped so I won't be able to produce x86_64 Mac builds, hope this doesn't cause any problem.
Other changes:
Full change log:
https://github.com/maccasoft/spin-tools/compare/0.50.0...0.51.0
Thank you, Marco. The outline is much easier for me to read using Consolas and a slightly bigger size.
A niggly thing... It would be nice if there were more contrast between the icon colors in the object tree. Would it be possible to use the folder icon colors from Propeller Tool? I poked around your GitHub repository and found that those icons are 16x16 PNGs. In the spirit of imagining you saying, "Help me help you" (great line from the movie, Jerry Maguire), I downloaded the object tree icons and made versions that use Propeller Tool colors. They're a bit simpler with less shading, but I think this will help the contrast so that identifying local versus library files will be easier.
Thanks for considering, and thanks, again, for the update. I'm sure I speak for of a lot of forum members when I say that we sincerely appreciate everything you're doing with Spin Tools IDE, and being open to user requests.
@macca
Thanks for Vers. 0.51
The Problems with MacOS 26.x text selection and complex structs are fixed.
I have added your icons, seems good to me:
I'll use them in the object tree only, the file browser still uses the current icons to be consistent. Maybe it would be good to better highlight the spin files, however I would like to keep the color gradient style.
Just for info, I'm using the Fugue Icons from https://p.yusukekamiyamane.com/ there is also the PSD source, however it doesn't import correctly with Gimp (even the latest version 3.x has problems).
Thank you!
Excellent!
I agree. Grazie! Grazie! Grazie!
No problem -- it's a visual thing for me. Here's an example where better contrast would be helpful.
A bit of a chuckle... in that same post I was going to ask if you could show the file location by hovering over an element in the object tree -- but it's already there!
Again, thank you so much for this great tool!
Great work here, couple comments...
in an if expression like
if n < "a"doesn't 'a' mean the same thing as "a" ?
Compiler doesn't like the first...
I do like the "View Character Chart..." feature of Prop Tool.
Start that up a lot just to use that...
Remember that an apostrophe (single quote) is a line comment character in Spin.
Ooops, that's right. Don't know what I was thinking... Guess mixed up with C...
C
'a'is same as Spin"a", it is a single character without null termination. C"a"is same as Spinstring("a"), which has the null termination.More importantly, the former is a single character scalar, the latter is a pointer.
I've started using spin tools a couple weeks ago and it's great!
One little thing, then using debug scope, my scope screen doesn't show any data until it seems like the first whole line of data is captured...
This is the example in spin2 document, and it does it also...
CON _clkfreq = 10_000_000
PUB go() | i
debug(
SCOPE MyScope SIZE 254 84 SAMPLES 128) debug(MyScope 'Sawtooth' 0 63 64 10 %1111)repeat
debug(
MyScope(i & 63))i++
waitms(50)
not a big deal, no urgency, just thought you might want to know...
Thanks,
Mike
Noticed some things when trying to get this raycast code to compile with FlexProp just now... Haven't done that in a while, used to work...
Gives me a strong warning about a
jatn spriteretbecause should bejatn #spriteretAlso doesn't like
if_b debug ("Hit!",udec(x))Don't know why...But, probably a more real issue is several
setq2 #SpriteListSize*SpriteListLongs*4that should besetq2 ##SpriteListSize*SpriteListLongs*4Ooops, actually, that #4 shouldn't be there... That's a bad bug...
Kind of surprised code works at all with these errors in it...
Had to hunt for a way to generate a binary file... Found it under Tools-->Show Info.
Since Spin Tools does not appear to create a binary file at every compile, maybe this should be easier to find?
Just a thought...
That's how Propeller Tool works, too -- probably modeled after that.
The Spin Tools "( i )" toolbar option brings up the Show Info dialog.
On the toolbar... I've never been able to figure out the "annotation" and "edit location" buttons. With bookmarks in place now, I'd like to see the "annotation" or "edit location" buttons used to more between bookmarks (the other set can be removed).
Something that always catches me out is the Tab key not replacing a selection (other keys do). I looked closely and see that when pressing Tab with a selection, it causes the cursor to move to the right side of the selection (if it's not already there).
AFAIK, the Character Chart shows the Parallax font or maybe better the font in the P1 rom.
The Parallax font can be used in Spin Tools, although is not the default, so maybe a more generic font viewer is more appropriate, it is not that easy with all the UTF-8 characters extensions, etc. also the OS should have an applet of some kind to see all fonts. I have to think about that.
Not sure you have posted in the right thread...
The conditional in the debug statements was introduced in PNut v50, maybe it wasn't yet implemented. Beware that the condition actually generates a skip instruction in addition to the debug instruction.
That's an issue in Spin Tools, another missing limit check...
Yes, that was made like Propeller Tool.
With an IDE that can directly upload the binary code, generate a binary file is not that frequent.
The Next/Previous Annotation buttons are used to quickly navigate though errors and warnings without the need to scroll the source or click on the bar at the right of the editor, errors take priority, so if you have a source with some errors, the buttons navigate through all errors, once fixed they navigate through warnings if any.
The Previous/Next Edit Location buttons should work as a sort of breadcrumb to navigate through code, the implementation may be a bit flaky, but so far it works (at least for me).
As an example, if you go to a bookmark, the previous edit location button should move back to the original location, without the need to add a temporary bookmark or remember where you were.
Same if you CTRL+click on a method definition, the previous edit location moves back to the original location.
The next edit location moves again to the bookmark or method definition, the location is kept until another event resets the "forward history", like clicking another bookmark.
Maybe because the TAB is used to indent the block. I see that if you select the space before a statement, then the ident doesn't work. It works if you select the whole line.
I'll see if I can fix it.
Thanks for the explanation, Marco.
Released version 0.52.0
Implemented the last two missing debug windows SPECTRO and MIDI, now it should be feature complete.
Implemented an initial support to open files from OS files associations.
On Linux, the association should be installed with the ./spinide --install command along with the desktop launcher.
On Windows, the install method is not yet implemented, it should work by right-clicking on the .spin/.spin2 files and select Open With... and manually browse to the spinide.exe.
On MacOS, I don't know if it works (sorry, my testing on MacOS is very limited), it certainly needs some more implementations but I think most needs an actual executable instead of a shell script, with all the signature issues this involves.
Also implemented drag and drop files to the editor, if you have Spin Tools IDE open, drag a source file from a File Exporer (or the corresponding applet on your OS) and drop to the editor area to open it.
Other changes:
When running the attached demo in debug with 0.52.0, I notice that the scope window is very much slower than in 0.51.0
Cheers, Bob
Scope debug window is working properly for me now... Before it would not display any data untill a whole window of data was collected, thus taking a while... Now it starts tracing data immediately, like in Pnut...
Thanks!
Mike
I see, seems that the fix for the scope draw had an unexpected effect on Windows, I don't notice any slowness on Linux but on Windows it is really too slow.
I'll try to find an alternative.
Thank you for the update, @macca!