Shop OBEX P1 Docs P2 Docs Learn Events
low current measurements — Parallax Forums

low current measurements

gio_romegio_rome Posts: 48
edited 2014-06-16 11:33 in Propeller 1
Hi guys,

I'm having troubles measuring low currents (<300mA).

I'm using an Allegro ACS712 hall-effect probe connected with a MPC3208 12bit ADC and then to the Propeller chip.

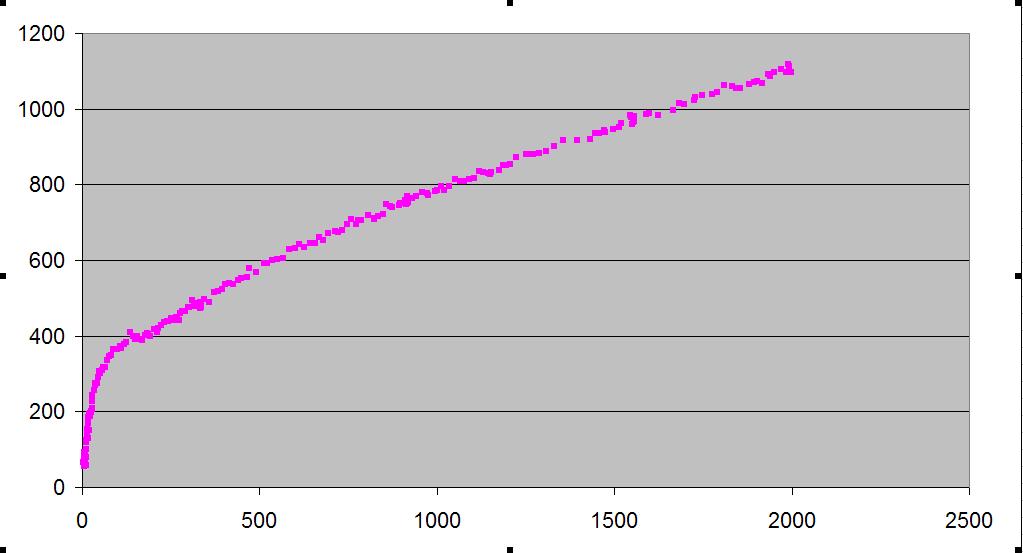
What I have is non linearity of I vs V, as you can see from the graph below a certain value.

Any suggestions?

Tnx,

G.
1023 x 553 - 36K

Comments

  • LeonLeon Posts: 7,620
    edited 2014-06-12 04:34
    Schematic?
  • gio_romegio_rome Posts: 48
    edited 2014-06-12 05:56
    Leon wrote: »
    Schematic?

    The source is a VAC usually 220V.

    The V is linear and very well measured with the output of a PCB transformer (0-230V => 0-6V).

    The I comes from the Vout pin of an ACS712-05 Allegro hall-effect sensor chip, that receives a +5V and a Ground references.


    VAC => ACS712 => resistor LAMP

    V=RI I need to measure independently both V and I.

    Hope that clears things out.
  • kwinnkwinn Posts: 8,697
    edited 2014-06-12 08:13
    Using a lamp as the current limiting resistor may be part of the problem. The resistance of the lamp will increase with the temperature of the filament. Use a resistor instead.
  • LeonLeon Posts: 7,620
    edited 2014-06-12 09:03
    gio_rome wrote: »
    The source is a VAC usually 220V.

    The V is linear and very well measured with the output of a PCB transformer (0-230V => 0-6V).

    The I comes from the Vout pin of an ACS712-05 Allegro hall-effect sensor chip, that receives a +5V and a Ground references.


    VAC => ACS712 => resistor LAMP

    V=RI I need to measure independently both V and I.

    Hope that clears things out.

    Schematic?
  • LawsonLawson Posts: 870
    edited 2014-06-12 09:26
    UNITS? (what ARE the units on that graph?) I guess I'll have to assume the unit's on that graph are pundits vs pop-songs.

    More seriously though, at least the response is monotonic so you should be able to calibrate it out if needed.

    Marty
  • gio_romegio_rome Posts: 48
    edited 2014-06-13 01:33
    graph units are "bits". The ADC is 12-bit, so the numbers go from 0 to 4095. Those bits are linearly correlated to the ACS712 output, which is linearly correlated to the current input, or at least that's what is supposed to be happening.

    Now, the hypothesis here is that the Ohm effect of changing the resistor value with the increase of temperature, that goes with the current, breaks the linearity...and that happens with low current in that it just then when it starts to load the lamps and increase their temperature...uhm...

    still thinking....perhaps then the current sensed is RIGHT, in that is R that changes too...
    what do I do? ;)

    for the schematics, I think I was clear enough, or am I not? please be more esplicit,

    thank you

    G.
  • MJBMJB Posts: 1,235
    edited 2014-06-13 03:22
    gio_rome wrote: »
    for the schematics, I think I was clear enough
    G.
    NO
    a picture tells more than a 1000 words ...
  • gio_romegio_rome Posts: 48
    edited 2014-06-13 05:09
    SCHEMATICS.jpg

    here
    1024 x 640 - 31K
  • MJBMJB Posts: 1,235
    edited 2014-06-13 07:22
    gio_rome wrote: »
    here
    - how do you connect AC to ADC ?
    - is the whole setup grounded ?
    - what is your intention to measure?
    - power meter (Watts)
    - phase angle ?
    - resistance ?
    ??
  • gio_romegio_rome Posts: 48
    edited 2014-06-13 07:58
    MJB wrote: »
    - how do you connect AC to ADC ?
    - is the whole setup grounded ?
    - what is your intention to measure?
    - power meter (Watts)
    - phase angle ?
    - resistance ?
    ??

    The pins on the lower side of the scheme are inputs and outputs.

    +5V provides power to the chip
    GND is ground
    V and I are the outputs toward the ADC

    The power circuits is grounded in that VIN is connected to the mains and therefore grounded. It is a VARIAC.

    I just want to measure V and I, independently to the load applied.
  • kwinnkwinn Posts: 8,697
    edited 2014-06-13 14:39
    IF you are using a light bulb of some kind as the load then it is almost certain that R is changing with current. When a bulb filament is cold it's resistance is much lower than it is after it warms up. That is why light bulbs usually die when you turn them on. The large inrush current causes the weak spot in the filament to melt and arc over, which creates the bright flash.
    gio_rome wrote: »
    graph units are "bits". The ADC is 12-bit, so the numbers go from 0 to 4095. Those bits are linearly correlated to the ACS712 output, which is linearly correlated to the current input, or at least that's what is supposed to be happening.

    Now, the hypothesis here is that the Ohm effect of changing the resistor value with the increase of temperature, that goes with the current, breaks the linearity...and that happens with low current in that it just then when it starts to load the lamps and increase their temperature...uhm...

    still thinking....perhaps then the current sensed is RIGHT, in that is R that changes too...
    what do I do? ;)

    for the schematics, I think I was clear enough, or am I not? please be more esplicit,

    thank you

    G.
  • jmgjmg Posts: 15,183
    edited 2014-06-13 16:06
    gio_rome wrote: »
    still thinking....perhaps then the current sensed is RIGHT, in that is R that changes too...
    what do I do? ;)

    When you get results that puzzle, it is a good idea to reality check your setup with a Multimeter.
    ie check what the actual current flowing is, not what you think it might be.
    2 Multimeters would allow you to read both I and V and plot those, with your own metering paths.
  • Dr_AculaDr_Acula Posts: 5,484
    edited 2014-06-13 16:20
    UNITS? (what ARE the units on that graph?) I guess I'll have to assume the unit's on that graph are pundits vs pop-songs.

    Yes, that got me too. Initially I thought the y axis was current and the x axis was a changing load, eg a variable resistor. But thinking about it more, I think the x axis might be Time. Is that correct?

    If so, it is the expected result from a lightbulb.
  • kwinnkwinn Posts: 8,697
    edited 2014-06-13 17:42
    I'm pretty sure the graph is current vs voltage since he stated :

    "What I have is non linearity of I vs V, as you can see from the graph below a certain value. "

    With current on the x axis the graph shows current increasing rapidly with applied voltage until the filament starts to heat up. At that point the resistance has increased and the rate of current increase slows and becomes more linear.

    It would be simple to plot the change of the resistance vs power applied using R = E / I and P = E x I from the current graph data points.
  • Mark_TMark_T Posts: 1,981
    edited 2014-06-16 06:28
    kwinn wrote: »
    I'm pretty sure the graph is current vs voltage since he stated :

    "What I have is non linearity of I vs V, as you can see from the graph below a certain value. "

    With current on the x axis the graph shows current increasing rapidly with applied voltage until the filament starts to heat up. At that point the resistance has increased and the rate of current increase slows and becomes more linear.
    I think you mean current on the y-axis, the vertical axis?

    Yes, the resistance of the filament will be about 10 times less at room temp than at white-hot. Look up
    the resistivity of tungsten against temperature if you want to double-check. The actual resistance is
    proportional to the reciprocal of the slope of a line from the origin to the point in question.

    There is no simple relation between current and temperature since the filament will be losing heat by
    both radiation and conduction and convection, all of which have different dependencies on temperature.

    The slope of the curve is related to the rate of change of conductivity with voltage (which controls
    temperature), and I wouldn't call it linear!

    It would be simple to plot the change of the resistance vs power applied using R = E / I and P = E x I from the current graph data points.
  • kwinnkwinn Posts: 8,697
    edited 2014-06-16 09:46
    Yes, I meant current on the Y axis, and by "more linear" I meant that after 400 on the Y axis it was a slightly better approximation to a straight line. If you drew a straight line from the point at 400 to the highest point on the graph the difference between the points on that line and the actual points would differ by less than 10%.
  • Mark_TMark_T Posts: 1,981
    edited 2014-06-16 11:26
    There's no reason to expect a straight line anywhere, you've got several things conflated there:

    power depends on resistance and current (or voltage).

    temperature depends on power (complex non linear fashion)

    resistivity of tungsten depends on temperature (maybe quasi-linear, but will be
    potentially discontinuous at phase transitions).

    You are plotting current against voltage as a way of displaying 1/resistance, so there is a whole chain
    of non-linear relationships in there. And the slope of the curve represents something rather convoluted
    (do the algebra if you have a spare hour!)

    You'd normally want to plot resistance against something, preferably temperature (but thats tricky to measure
    especially as a filament is different temperatures along its length!).

    That's the physicists approach at least.

    As an EE all you need to know is the maximum current transient on switch on and the steady state current
    at nominal voltage, surely? Or perhaps bulb life against voltage over-drive?
  • GenetixGenetix Posts: 1,758
    edited 2014-06-16 11:33
    A refresher for those who may have forgotten:
    The Independent variable goes on the X-axis.
    The Dependent variable goes on the Y-axis.

    ie: d vs. t (distance versus time)
Sign In or Register to comment.