PE Kit Lab - ViewPort Continued (Debugging)
 Andy Lindsay (Parallax)
Posts: 1,919
Back to PE Kit Labs, Tools, and Applications.···
Debugging with ViewPort
·
ViewPort is a graphical interface for the Propeller chip.· On the Propeller side, ViewPort objects utilize one or more of the Propeller’s processors for streaming variable and/or I/O pin information to the PC.· On the PC side, ViewPort software makes it possible to choose from a variety of display formats, including debugging, terminal, logic analyzer, oscilloscope, xy plotter, spectrum analyzer, custom instruments, fuzzy logic, and OpenCV video.
·
The ViewPort PE Kit Lab introduced how to get started with ViewPort and demonstrated several applications with its oscilloscope, logic analyzer and spectrum analyzer features.·
·
ViewPort PE Kit Lab – Logic Analyzer and Oscilloscope
ViewPort PE Kit Lab – Oscilloscope and Spectrum Analyzer
·
This article focuses on how to incorporate a Spin program into ViewPort’s debugging environment.
·
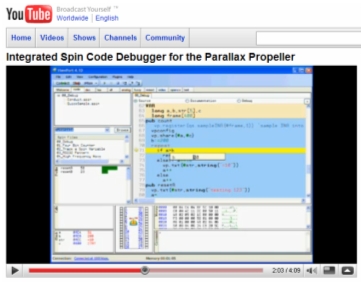
P······ To get familiar with the ViewPort’s IDE style debugging environment, take a few minutes to watch this video.
P······ Download and unzip PE Kit Lab - PE Kit Lab - Debugging with ViewPort.zip.
·

Code Modifications
Here is a simple timekeeping program.· Testing the minutes portion of the code either takes a program modification, or you’ll have to wait a minute to verify the output.· With ViewPort, you can set a breakpoint in the program and then verify that it increments the various counters like it should.
·
'' Second and Minute Counter.spin
CON
·_clkmode······· = xtal1 + pll16x
·_xinfreq······· = 5_000_000
·
VAR
·
· long ms, s, m
· long t, dt
·
PUB TestTimekeeping
·
· t· := cnt
· dt := clkfreq/1000
· repeat
··· waitcnt(t+=dt)
··· ms++
··· if ms//1000 == 0
····· s++
····· if s//60 == 0
······· m++
·
Here are the steps modifying a program for ViewPort debugging.
·
1) Copy your application files to ViewPort’s mycode directory.· Currently, that’s C:\Program Files\ViewPort41\mycode\
2) Open ViewPort, click the code tab, and use the dropdown menu next to the Browse button to set the working directory to MyCode.·
3) Double-click the file you want to work with in ViewPort’s Spin Files list to open it.
3) Add vp : “conduit” to the OBJ block, or if the object does not already have an OBJ block, add one with the vp declaration.
4) Add long frame[noparse][[/noparse]400] to the VAR block.· (Or add a VAR block with this declaration if the program doesn’t have one.)
5) Make sure any variables you want to examine are long variables the global VAR section.
6) Optionally, add a vp.config call that assigns names to the variables you have shared.· For example:
·
· vp.config(string("var:ms,s,m"))
·
7) Pass the start and end addresses of a contiguous group of long variables (not bytes or words) that you want ViewPort to display to the conduit object’s share method.· These long variables should be located in the program’s VAR block.· It’s also a good idea to add a one second delay, especially if you want to set a breakpoint immediately after vp.share.
·
· vp.share(@ms, @m)
· waitcnt(clkfreq + cnt)
·
8) Modify any instance of waitcnt that uses t+=dt so that it instead uses dt+cnt.· (For precise timekeeping, make sure to change it back when you are done with the debugging session.)
·
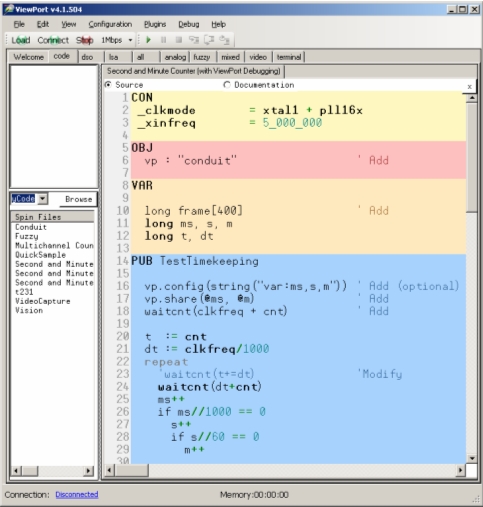
When you have completed these steps, your code should look like this:

·
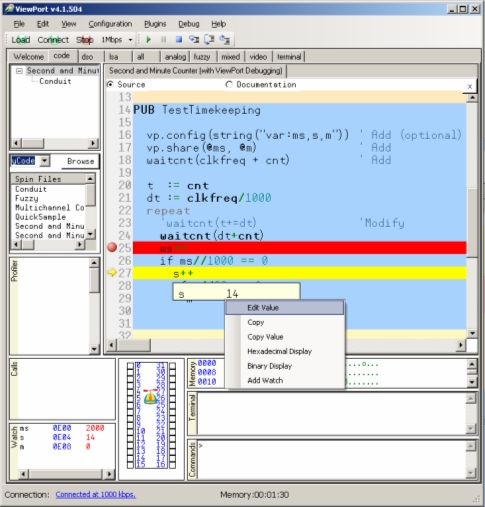
Now, you can go through the debugging steps featured in the YouTube clip.·
·
P······ To start debugging the code, click the run button.·
P······ Set a breakpoint at ms++.
P······ Change the value of the ms variable to something that ends in 999
P······ Change the value of the s variable to something some multiple of 60, minus 1 (59, 119, or 179 for example).·
P······ Single-step through the repeat loop, and verify that the second counter and minute counter when ms reaches 1000 and s reaches a multiple of 60.
·
·········
Examine it Graphically
ViewPort’s most significant strength is in its ability to provide graphical information about a program’s performance.· If ViewPort detects a variable named io, or use of its quicksample object, it will automatically update the I/O pins, either with the quicksample object, or an the value stored in io.·
·
····
·
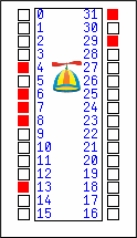
Here is a modified version of the program that stores ina in the io variable each time through the repeat loop.· If you debug this version of the program, the pin map in the code window indicates high signals with red.·· Pay close attention to P4..P6 in the pin map as you repeat the loop by setting a breakpoint and then repeatedly clicking run.· Repeat the test for advancing by seconds and minutes.
·
·
'' Second and Minute Counter (with ViewPort Debugging and IO).spin
CON
·_clkmode······· = xtal1 + pll16x
·_xinfreq······· = 5_000_000
·
OBJ
· vp : "conduit"················
·
VAR
·
· long frame[noparse][[/noparse]400]···············
· long ms, s, m, io················· ' Add io variable
· long t, dt
·
PUB TestTimekeeping
·
· vp.config(string("var:ms,s,m,io")) ' Add io variable
· vp.share(@ms, @io)················ ' Add io variable
· waitcnt(clkfreq + cnt)······
·
· dira[noparse][[/noparse]6..4]~~
· t· := cnt
· dt := clkfreq/1000
·
· repeat
··· io := ina······················· ' Update io variable
··· 'waitcnt(t+=dt)
··· waitcnt(dt+cnt)
··· ms++
··· outa[noparse][[/noparse]4] := ms
··· if ms//1000 == 0
··· ··s++
····· outa[noparse][[/noparse]5] := s
····· if s//60 == 0
······· m++
······· outa[noparse][[/noparse]6] := m
·
You can also click the LSA tab, and the Plot button next to the io variable to display io in the logic analyzer.· As with the pin map in the code tab, the I/O pins of interest are correspond to bits 4..6.· The time/division dial should be adjusted according to which signal you want to examine.· It is set to 500 ms/division to get a good look at bit 5.· You can also click next just to the left f bit 5 to make the display refresh based on bit 5.· 1 ms/division with the trigger set to bit 4 will allow for a close-up on the ms timing.· ·
·
·····
·
You can customize this display to only show bits 4..6.· See ViewPort PE Kit Lab – Logic Analyzer and Oscilloscope for more info.
·
·
·
▔▔▔▔▔▔▔▔▔▔▔▔▔▔▔▔▔▔▔▔▔▔▔▔
Andy Lindsay
Education Department
Parallax, Inc.
Post Edited (Andy Lindsay (Parallax)) : 5/4/2009 5:05:25 AM GMT
Debugging with ViewPort
·
ViewPort is a graphical interface for the Propeller chip.· On the Propeller side, ViewPort objects utilize one or more of the Propeller’s processors for streaming variable and/or I/O pin information to the PC.· On the PC side, ViewPort software makes it possible to choose from a variety of display formats, including debugging, terminal, logic analyzer, oscilloscope, xy plotter, spectrum analyzer, custom instruments, fuzzy logic, and OpenCV video.
·
The ViewPort PE Kit Lab introduced how to get started with ViewPort and demonstrated several applications with its oscilloscope, logic analyzer and spectrum analyzer features.·
·
ViewPort PE Kit Lab – Logic Analyzer and Oscilloscope
ViewPort PE Kit Lab – Oscilloscope and Spectrum Analyzer
·
This article focuses on how to incorporate a Spin program into ViewPort’s debugging environment.
·
P······ To get familiar with the ViewPort’s IDE style debugging environment, take a few minutes to watch this video.
P······ Download and unzip PE Kit Lab - PE Kit Lab - Debugging with ViewPort.zip.
·
Code Modifications
Here is a simple timekeeping program.· Testing the minutes portion of the code either takes a program modification, or you’ll have to wait a minute to verify the output.· With ViewPort, you can set a breakpoint in the program and then verify that it increments the various counters like it should.
·
'' Second and Minute Counter.spin
CON
·_clkmode······· = xtal1 + pll16x
·_xinfreq······· = 5_000_000
·
VAR
·
· long ms, s, m
· long t, dt
·
PUB TestTimekeeping
·
· t· := cnt
· dt := clkfreq/1000
· repeat
··· waitcnt(t+=dt)
··· ms++
··· if ms//1000 == 0
····· s++
····· if s//60 == 0
······· m++
·
Here are the steps modifying a program for ViewPort debugging.
·
1) Copy your application files to ViewPort’s mycode directory.· Currently, that’s C:\Program Files\ViewPort41\mycode\
2) Open ViewPort, click the code tab, and use the dropdown menu next to the Browse button to set the working directory to MyCode.·
3) Double-click the file you want to work with in ViewPort’s Spin Files list to open it.
3) Add vp : “conduit” to the OBJ block, or if the object does not already have an OBJ block, add one with the vp declaration.
4) Add long frame[noparse][[/noparse]400] to the VAR block.· (Or add a VAR block with this declaration if the program doesn’t have one.)
5) Make sure any variables you want to examine are long variables the global VAR section.
6) Optionally, add a vp.config call that assigns names to the variables you have shared.· For example:
·
· vp.config(string("var:ms,s,m"))
·
7) Pass the start and end addresses of a contiguous group of long variables (not bytes or words) that you want ViewPort to display to the conduit object’s share method.· These long variables should be located in the program’s VAR block.· It’s also a good idea to add a one second delay, especially if you want to set a breakpoint immediately after vp.share.
·
· vp.share(@ms, @m)
· waitcnt(clkfreq + cnt)
·
8) Modify any instance of waitcnt that uses t+=dt so that it instead uses dt+cnt.· (For precise timekeeping, make sure to change it back when you are done with the debugging session.)
·
When you have completed these steps, your code should look like this:
·
Now, you can go through the debugging steps featured in the YouTube clip.·
·
P······ To start debugging the code, click the run button.·
P······ Set a breakpoint at ms++.
P······ Change the value of the ms variable to something that ends in 999
P······ Change the value of the s variable to something some multiple of 60, minus 1 (59, 119, or 179 for example).·
P······ Single-step through the repeat loop, and verify that the second counter and minute counter when ms reaches 1000 and s reaches a multiple of 60.
·
·········
Examine it Graphically
ViewPort’s most significant strength is in its ability to provide graphical information about a program’s performance.· If ViewPort detects a variable named io, or use of its quicksample object, it will automatically update the I/O pins, either with the quicksample object, or an the value stored in io.·
·
····
·
Here is a modified version of the program that stores ina in the io variable each time through the repeat loop.· If you debug this version of the program, the pin map in the code window indicates high signals with red.·· Pay close attention to P4..P6 in the pin map as you repeat the loop by setting a breakpoint and then repeatedly clicking run.· Repeat the test for advancing by seconds and minutes.
·
·
'' Second and Minute Counter (with ViewPort Debugging and IO).spin
CON
·_clkmode······· = xtal1 + pll16x
·_xinfreq······· = 5_000_000
·
OBJ
· vp : "conduit"················
·
VAR
·
· long frame[noparse][[/noparse]400]···············
· long ms, s, m, io················· ' Add io variable
· long t, dt
·
PUB TestTimekeeping
·
· vp.config(string("var:ms,s,m,io")) ' Add io variable
· vp.share(@ms, @io)················ ' Add io variable
· waitcnt(clkfreq + cnt)······
·
· dira[noparse][[/noparse]6..4]~~
· t· := cnt
· dt := clkfreq/1000
·
· repeat
··· io := ina······················· ' Update io variable
··· 'waitcnt(t+=dt)
··· waitcnt(dt+cnt)
··· ms++
··· outa[noparse][[/noparse]4] := ms
··· if ms//1000 == 0
··· ··s++
····· outa[noparse][[/noparse]5] := s
····· if s//60 == 0
······· m++
······· outa[noparse][[/noparse]6] := m
·
You can also click the LSA tab, and the Plot button next to the io variable to display io in the logic analyzer.· As with the pin map in the code tab, the I/O pins of interest are correspond to bits 4..6.· The time/division dial should be adjusted according to which signal you want to examine.· It is set to 500 ms/division to get a good look at bit 5.· You can also click next just to the left f bit 5 to make the display refresh based on bit 5.· 1 ms/division with the trigger set to bit 4 will allow for a close-up on the ms timing.· ·
·
·····
·
You can customize this display to only show bits 4..6.· See ViewPort PE Kit Lab – Logic Analyzer and Oscilloscope for more info.
·
·
·
▔▔▔▔▔▔▔▔▔▔▔▔▔▔▔▔▔▔▔▔▔▔▔▔
Andy Lindsay
Education Department
Parallax, Inc.
Post Edited (Andy Lindsay (Parallax)) : 5/4/2009 5:05:25 AM GMT


Comments
▔▔▔▔▔▔▔▔▔▔▔▔▔▔▔▔▔▔▔▔▔▔▔▔
Andy Lindsay
Education Department
Parallax, Inc.
Post Edited (Andy Lindsay (Parallax)) : 5/4/2009 2:27:27 AM GMT
▔▔▔▔▔▔▔▔▔▔▔▔▔▔▔▔▔▔▔▔▔▔▔▔
Andy Lindsay
Education Department
Parallax, Inc.