

confusion when debugging assembler [solved]
 ManAtWork
Posts: 2,333
ManAtWork
Posts: 2,333
I have to admit that I don't fully understand how the debug interrupt and the BRK instruction work internally. What I do know or at least I thought I knew is that I can place debug() statements to my assembler code and if it's not too time critical I should be able to see what happens to some degree.debug ("test message")
tells me that control has reached this statement when the message appears in the terminal.debug (sdec (var1, var2))
prints out the values of the variables (cog registers). There may be some limitations in which case this doesn't work, for example, care should be taken not to place a debug between "linked" instructions like SETQ or ALTx and the following instruction. I also expect trouble when using debug() inside REP or SKIP sequences.
However, when using debug() in a linearly executed sequence of instructions without any jumps, branches or loops I would expect them to print the debug messages also in a linear order, one by one.
So I was very surprised that sometimes debug() statements seem to mask each other in some way I don't understand.
              mov       axis,#0
              mov       pinStp,pinStp0
              mov       pinDir,pinDir0
              wrlong    #0,adrTime
              debug ("MainLoop")
              'waitct1
              rep       RegLoop,#NumAxes        ' output all pin states AFAP
              altd      axis,#freq
              wypin     freq,pinStp
              testb     oldDir,axis wc
              drvc      pinDir                  ' DIR = sign of oVel before phase correction
              add       pinStp,pinInc
              add       pinDir,pinInc
              add       axis,#1
RegLoop
              'addct1    timeCnt,timePer
              rdlong    timeCnt,adrTime wz
        if_z  jmp       #RegLoop
              mov       oldDir,newDir
              setq      #NumAxes
              rdlong    nPos,adrRd              ' read nomPos[] + filterLen
              mov       ptra,adrRd
              add       ptra,#(NumAxes+1)*8     ' block pointer
              mov       ptrb,ptra
              add       ptrb,#BlockSize*NumAxes*4 ' buffer pointer
              add       bufInx,#1
              cmp       bufInx,filtLen wc       ' can't use incmod, filtLen can change on the fly
        if_ae mov       bufInx,#0
              mov       tmp,bufInx
              mul       tmp,#NumAxes*4
              add       ptrb,tmp
              mov       axis,#0 '#NumAxes-1
AxisLoop
' process filtering and moving flag
              setq      #BlockSize-1
              rdlong    block,ptra              ' swap in block
              debug ("Test1")
              rdlong    nVel,ptrb
              sub       fSum,nVel
              alts      axis,#nPos              ' fSum-= oldest vel from buffer
              mov       nVel,nPos
              sub       nVel,oPos wz
        if_nz mov       fCnt,filtLen            ' if nVel != 0 fCnt = filtLen
              add       oPos,nVel
              add       fSum,nVel               ' fSum+= newest vel
              wrlong    nVel,ptrb++
              cmpsub    fCnt,#1 wc              ' flag = --fCnt >= 0
              bitc      flags,axis              ' update moving flag
              debug (sdec (axis, nVel, fSum))
              abs       tmp,fSum wc
              qdiv      tmp,filtLen             ' nVel = fSum / filtLen
              getqx     nVel
              negc      nVel wcz                ' restore sign, C = new sign
              getqy     tmp
              debug ("Test2")
              sumc      fSum,tmp                ' add signed remainder to fSum
I would expect that this outputs something like
Cog1  MainLoop
Cog1 Test1
Cog1  axis = 0, nVel = 1, fSum = 1
Cog1 Test2
However, only the MainLoop and Test2 messages appear. Test1 and axis = 0... are missing. There are no jump labels in between and the rest of the code is actually working and calculates the correct results so I assume that every instruction is actually executed.
If I comment out the debug ("Test1") and debug ("Test2") then debug (sdec (axis, nVel, fSum)) works as expected and prints out Cog1 axis = 0, nVel = 1, fSum = 1. What's going on here? ![]()
I get the same results using PropellerTool and FlexSpin so I don't think it's a compiler problem. Full source code attached.
Comments
Yep, seems like you've found a bug in the debugger. Even at low baud it still does the same. I think Flexspin's BRK debug code uses Chip's sources so no surprise both compilers perform the same way.
Thanks Evan for confirming this. A bug in the debugger is very annoying. I don't want to blame anybody. I make stupid mistakes all the time. That's why I need a debugger.
I'm curious what causes this unpredictable behaviour. I'll try to add delays or try the other debug mode of FlexSpin.
Unfortunatelly, -g debugging doesn't work for assembler in FlexSpin. It only supports debugging in Spin code where debug() statements are then converted to printf-like commands. Adding a delay before or after debug() doesn't help either.
And on a related note, I didn't realize you could use multiple comma separated inputs with sdec/udec/etc. I see that is documented halfway down the list in "Things to know about the DEBUG system", but not in the debug statements details. Neat!
I just use printf() straight. Never seriously used any debugger. My pasm code has this sort of entry:
#ifdef _DIAG
        loc ptrb, #dbuf
        wrlong  pb, ptrb++
#endif
and later:
#ifdef _DIAG
        wrword  lat, ptrb++
#endif
If I need PTRB for main code then I'll change to using LOC PA, #array+offset for each debug store.
Then I have a debug dump routine I call after the dust settles, eg:
static void cmddiag( void ) { uint32_t i = _rev(dbuf[0]); printf( "CMD%d %08x%04x\n", (i>>24) & 0x3f, i, _rev(dbuf[1])>>16 ); }Yes, I have done something similar to debug time critical stuff where data transfer over the serial port would add too much delay. But I'd like to get the BRK style debugging to work, anyway. It is simpler to use and works even if the code crashes in the middle between debug actions.
Today, I tried to simplify the test code as much as possible. Surprisingly, if I replace nearly all of my code with NOPs all debug() outputs are shown correctly. So either my code is faulty or some special instructions trigger a bug in the compiler.
DAT
  ORG
StepDirEntry
              mov       adrTime,ptra
              add       ptra,#4
MainLoop
              wrlong    #0,adrTime
              debug ("MainLoop")
RegLoop
              rdlong    timeCnt,adrTime wz
        if_z  jmp       #RegLoop
              mov       axis,#0

              debug ("Test1")
              nop
              debug (sdec (axis, nVel, fSum))
              nop
              debug (sdec(tmp))
              nop
              debug ("Test2")
              nop
              debug (sdec (aVel, fRem))
              nop
              jmp       #MainLoop
I'll put my code in, again, step by step and see when the problems begin to re-appear.
AAArrrrgghhh! It's the REP instruction.
rep RegLoop,#NumAxesdoesn't work,rep #RegLoop,#NumAxesdoesn't, either.rep #7,#NumAxesfixes it. Wasn't REP supposed to work with labels? I thought so. I have to disassemble it to look what machine code the compiler actually generates.Grrr, one more example of how the combination of my bad memory and lack of good documentation can lead to a lot of wasted time and frustration.
I knew REP should work with labels but forgot the exact details. REP is still not included in the P2 Assembler Language Manual. But it's here (thanks Ada). So "@" does the trick, not "#". And it's also mentioned that REP stalls interrupts including the BRK interrupt used by debug(). So leaving out the important "@" lead to REPing too many instructions which blocked some the debug()s. Good to know that nothing spooky happened and there is no compiler bug.
I missed that too. The # didn't stand out to me. I've always known to use an @ but I can't remember why Chip chose it over the #. It is an anomaly in Pasm2.
@does more than#andrep @label,repsis simpler thanrep #label-($+1),repsorrep #label-$-1,repsI don't see that as a reason for a new syntax. The REP's label just needs a special case calculation during compiling is all.
This does sound like another case where it would be nice for the compiler to emit a warning, since it's pretty rare for someone to want to say
rep foo, #barwhenfoois a label with code following it. I've added such a warning to flexspin just now.Good idea. And
REP #foo, #baralso could be in that warning.Oh, actually it is, I just forgot to mentionn that case") .
.
Yes, a warning is a good idea. There are so many cases where a single character can make the difference between working perfectly and total desaster. Working on different projects in Spin1 Spin2 and C at the same time makes it even harder...
But as soon as you do it right it works as expected.")
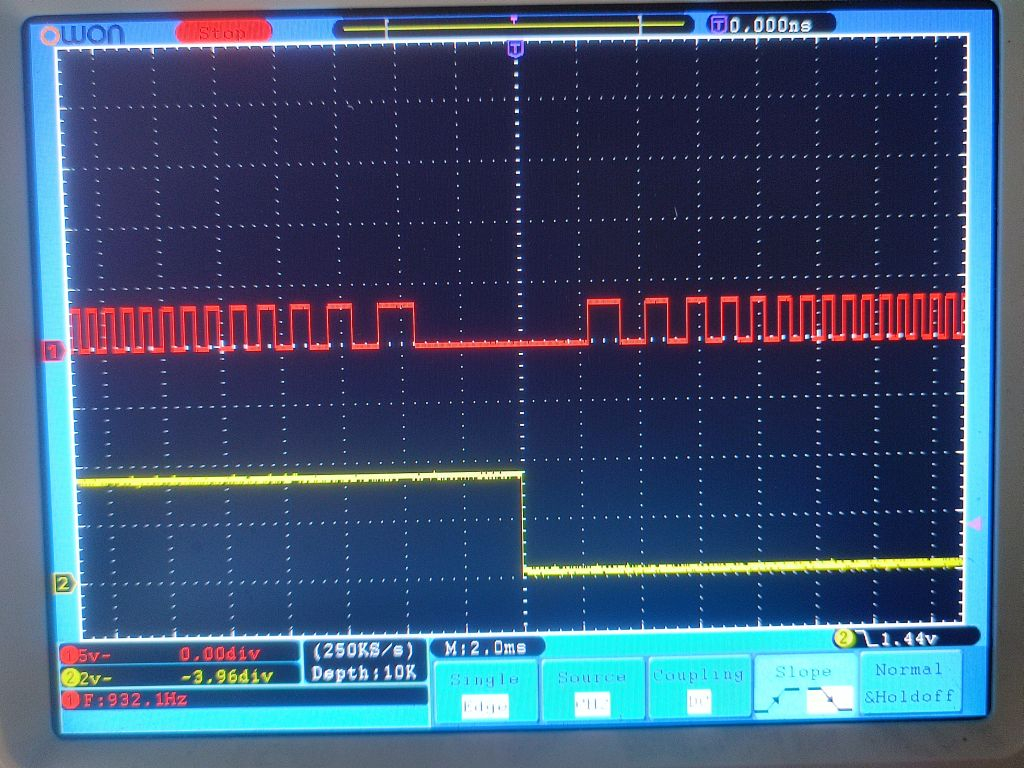
Nice and smooth acceleration nearly without phase jitter. Opposed to interrupt based step/dir generation the duty cycle is always 50% and direction only changes while step is low. So setup/hold time problems and narrow pulses are avoided.