Copy/Paste from DEBUG Output window
 VonSzarvas
Posts: 3,639
VonSzarvas
Posts: 3,639
in Propeller 2
Has anyone got a workaround for copy/pasting data from the PropellerTool DEBUG Output window ?
Seems it's locked on Windows 11, and I really could do with it whilst debugging some long strings.
@"Jeff Martin" - Please- Any tips ?
Opening another term program with com port sniffing seems clunky, but looks like plan A. right now.
Hmm. Wonder if we can replace the default DEBUG output window with an .exe of our choice. HTerm would be great !
As I type this, realised I should try with PNUT. Maybe that DEBUG window has different behaviour.
Comments
The DEBUG output window doesn't support selecting and copying text.
You can use the DEBUG log feature, which automatically saves a file (of a maximum size you can specify with DEBUG_LOG_SIZE) for every time you run the P2 code. In the Propeller Tool, that file gets stored to your My Documents\Propeller Tool folder.
I forgot how this works, so I looked it up. You simply have to define a constant of DEBUG_LOG_SIZE = nnn (where nnn is a number; in bytes/characters) that defines the maximum size of the log file to generate. This constant defaults to 0, which means "don't generate a log file." If it's >0 then anything that arrives at the DEBUG Output windows is stored into the DEBUG.log file in your My Documents\Propeller Tool folder. ie: just opening that file in Notepad++ or similar will allow you to view everything up to the size limit you chose, as soon as it's been received (assuming it's an editor that will prompt you and allow refresh).
PNUT appears to run the same "locked" output window. Poop!
COM port sniffers in the freeware column looking elusive.
Hardware solution works fine-- a 2nd prop-plug to capture the data from the first. Now I can monitor all serial data with any term software. A bit of extra effort, but not a tragedy.
Thanks Jeff.
Any way to force the save frequency (or click somewhere to force a single flush/save), rather than having to close the debug window before getting the last line of log text written to the file?
I can imagine the issue, and assume that's just how it works so no need to answer. It's not really a good solution for a few reasons, so I'll stick with the twin prop-plugs now that's setup.
However, good to know about the option- I hadn't noticed that before, and will be handy when travelling.
Maybe one request, to add copy/paste to the "nice things to have" list, should you be doing any work on the editor in the future.
Cheers !
I didn't know that it worked that way (not saving immediately)... I see that now.
Not sure why it's like that, but it's probably something that can be fixed.
I have reported this problem and some others related to the debug window several times but it never got fixed.
I add one more to the list:
PNut opens the debug window always at positionn (0,0) when started from the command line. It would be more convenient if size and position of the debug window was remembered from the last call.
And this one is also not fixed, yet: Propeller Tool source file dependency tree doesn't show until window resized
Another: The debug output window doesn't repaint after resize operation.
Starting at last known is ok, provided the code detects the monitor still exists and the window would be inside the viewable area (ie. Resolution wasnt changed). Else should default to 0,0 (or center) of active monitor.
It works the way it does for ultimate speed. Only the bottom line is actually written with text and the rest of the canvas is scrolled with a memory move. This allows 2MBaud data to not overwhelm it badly.
Ah ha! That explains why the debug window sometimes (albeit rarely) grabs innocent content from other windows elsewhere on the monitor and displays it (perhaps only from below the modal, but that's not certain). Not a big deal, until you're live streaming a demo and end up showing the world "sensitive content"")
I don't believe that is something to be addressed, but just to note the behavior exists for the future boiling pot.
I don't know how the scrolling in Windows actually works and why the display contents are erased or corrupted if the window is resized or moved. But I think if the drawing is fast enough to update at 2Mbd then it should also be possible to...
The human eye can't catch up with more than 10 or 20fps, anyway. So printing faster doesn't make any sense. But the buffer would allow re-painting the window contents after a re-size or move event.
Sometime debug output shows up in short bursts of many lines. If they don't fit into the small window I often like to make the window larger or scroll up to look up previous output that has already scrolled out. With the current implementation this is not possible.
This is what I came up with for the current project. Please excuse the quick hand-drawn wiring diagram")
It's a modified WX Adapter. I removed the existing sockets, but could have just used the sockets on a stock-board and male-male headers instead.
The jumper wire allows me to "sniff" either the TX or RX signal. And optionally connect the reset signal to the second prop-plug, which might be handy later.
The board accepts two Prop-Plugs so that the programming Prop-Plug can hook into the same place and keep the cabling together (ie. this replaces the 4-pin prop-plug header on the breakout boards).
You could just hook the second prop-plug into the P56-P63 accessory header of course, using short male-female jumper wires from GND-GND and either P62 or P63 to PropPlugRX (depending on which serial signal you'd want to sniff). Hmm. And with a third prop-plug you could do that to monitor all channels easy enough... Oh well, I have this board now, so might as well share")
Anyway- the output shows the normal debug output window, and at the same time data in the HTERM program, which provides some neat features for debugging, including...
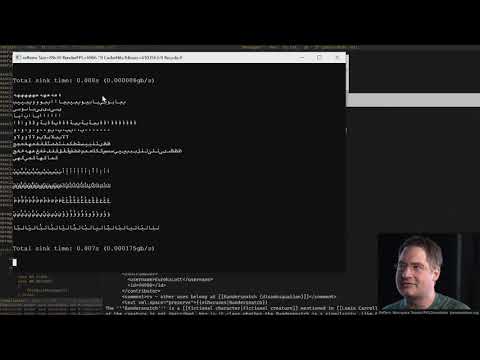
If your terminal can't chew down hundreds of millions of characters per second, it sucks. According to this guy's thing, anyways: https://github.com/cmuratori/refterm
related rant video: