

MOSFET data sheet
 JRoark
Posts: 1,215
JRoark
Posts: 1,215
I’ve got a basic question about how to read a MOSFET data sheet.
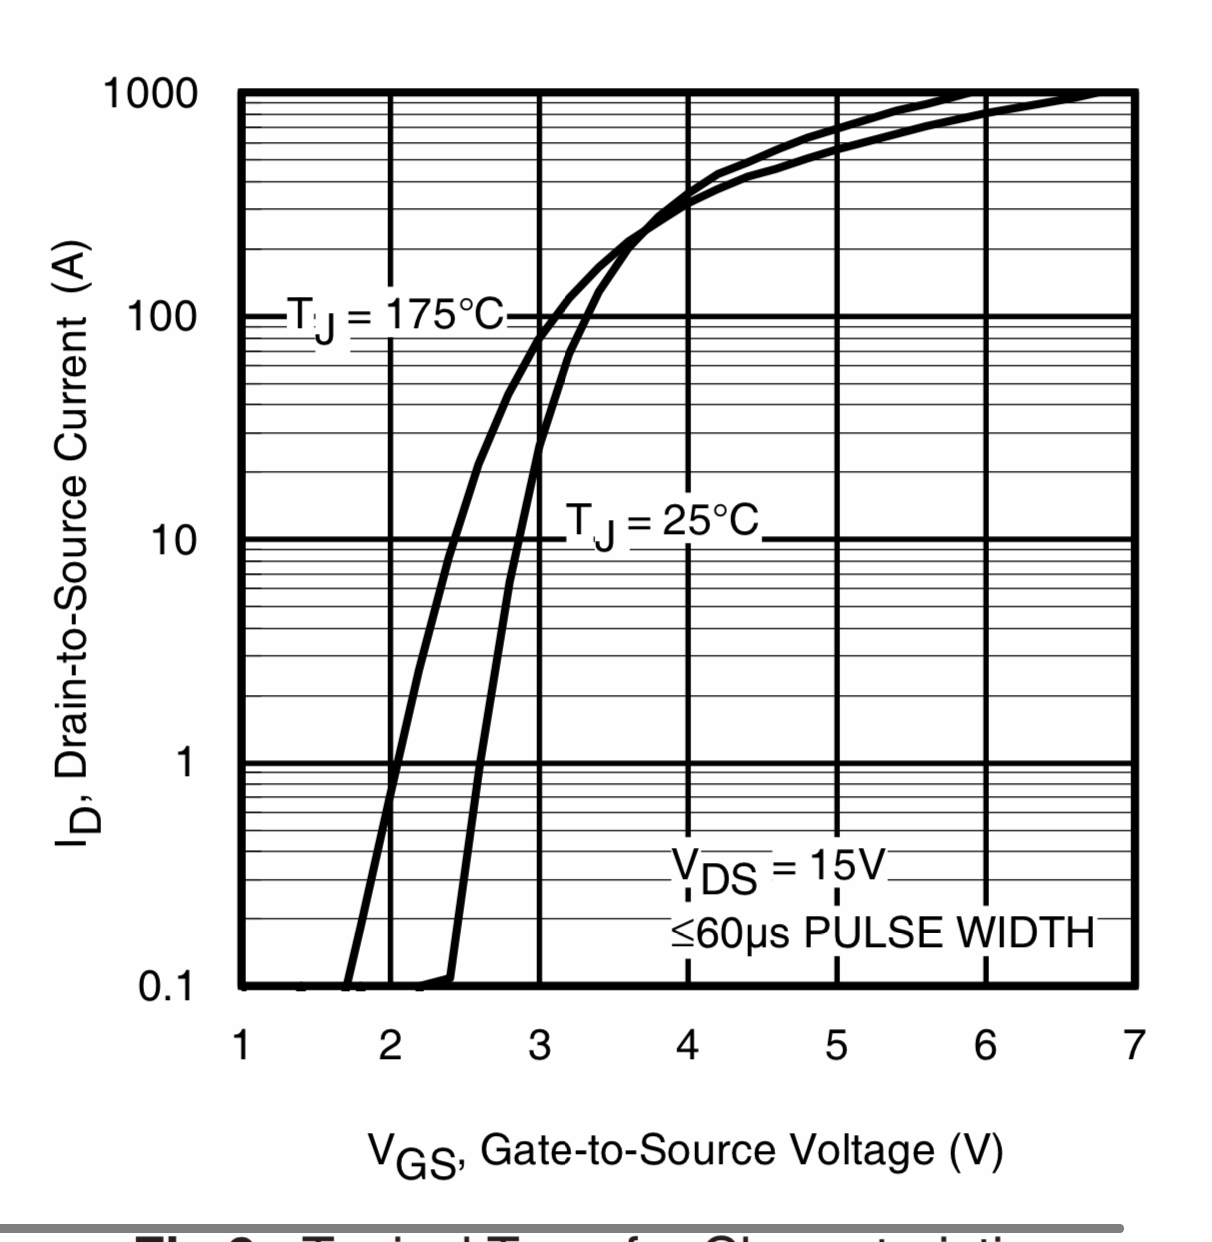
Consider the two curves below. On the vertical axis, one uses integer notation, the other uses an exponent notation. Today, while talking to a friend I was floored when he stated that you read the curves differently. He stated that when you see the integer notation format you simply interpret the unlabeled values as integers. For example if you see labels of “10” and “100”, that suggests that each division is an INTEGER number (ie, 10, 20, 30…90, 100). I have no quibble with this, and it is how I have always read them.
But here is the rub: he emphatically states that when you see labels of “10^1” and “10^2”, this means EACH DIVISION CORRESPONDS TO AN INCREASE IN THE EXPONENT, for example 10^1.0, 10^1.1, 10^1.2…. 10^1.9, 10^2.0
Can one of the hardware guys weigh-in here? Which way is right? The data sheets silent on this issue.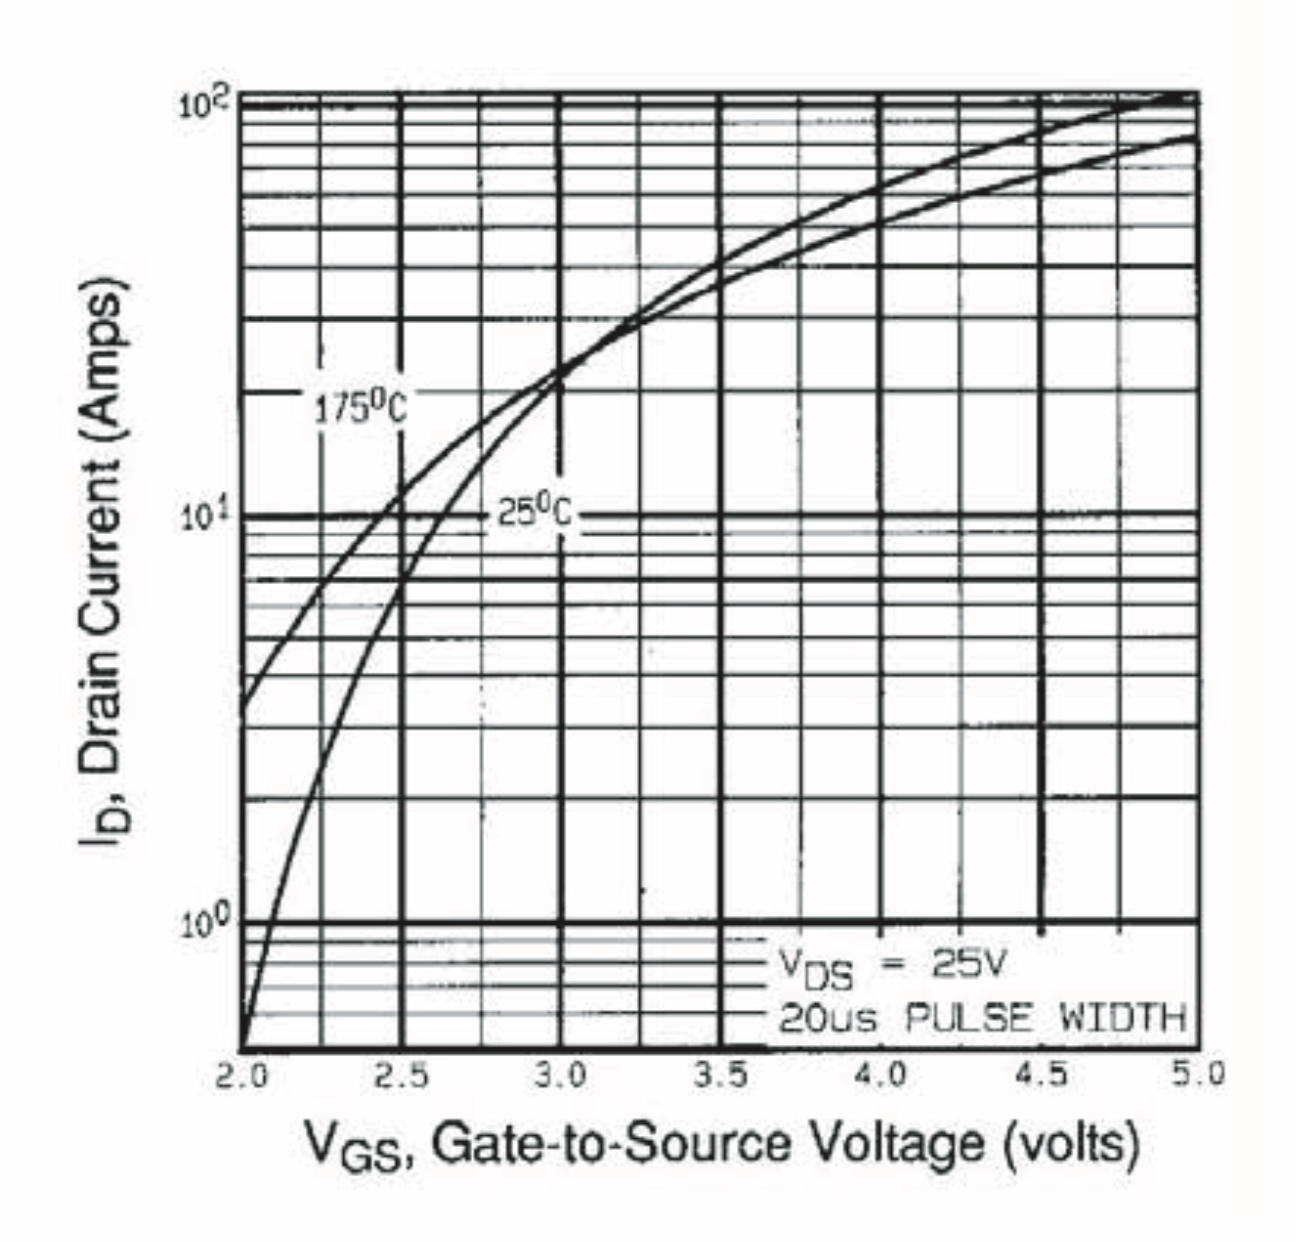
Comments
you can sanity check that yourself, by seeing that 10^1.9 = 79.43, or 10^1.2 = 15.848, so those come up short.")
I've always read the fine lines between 1-10 as being simply 2 thru 9 (as you would expect) and as anyone would plot.
No one is going to want to try to plot on graph paper with lines at 15.848 and 79.43
The graphs at both curves above where constructed using semi logarithmic scales, where the displacements at the vertical axis (Y) is represented in incrementally logarithmic lenght-steps (e.g. 10, (20, 30, 40, 50, 60, 70, 80, 90), till 100)), while the displacements at the horizontal axis (x) is represented in incrementally linear lenght-steps (e.g. 1, 2, 3, 4, 5, 6, 7, 8, 9, 10)).
The way each outstanding point is expressed is irrelevant; either 10, or 10 raised to the power of 1 are the same number, so are 100, or 10 raised to the power of 2.
So, one thing is the way one expresses the measurement, the other is the way the scale is constructed (dimmensionally).
Your friend's thinking can be useful when one tries to interpolate the logarithim scale within any two outstanding points, in order to be sure to not take a linear midpoint as being 50% of the logarithmic interval between any two consecutive lines.
10 ^ 1.0 = 10 <=> log (10) = 1.0
10 ^ 1.1 = 12.6 <=> log (12.6) = 1.1
10 ^ 1.2 = 15.8 <=> log (15.8) = 1.2
10 ^ 1.3 = 19.9 <=> log (19.9) = 1.3
10 ^ 1.4 = 25.1 <=> log (25.1) = 1.4
10 ^ 1.5 = 31.6 <=> log (31,6) = 1.5
10 ^ 1.6 = 39.8 <=> log (39.8) = 1.6
10 ^ 1.7 = 50.1 <=> log (50.1) = 1.7
10 ^ 1.8 = 63.0 <=> log (63.0) = 1.8
10 ^ 1.9 = 79.4 <=> log (79.4) = 1.9
10 ^ 2.0 = 100 <=> log (100) = 2.0
Hope it helps a bit
Henrique
https://en.wikipedia.org/wiki/Semi-log_plot
Where did the tenths of exponents idea come from?
It seems to me all he is saying is the graphs without exponents printed are to be read as direct integers. But, as is the case with the second graph, the graph scale is still logarithmic. As for what a "division" constitutes, he could easily have meant the major divisions of every whole exponent.
The Y axis in both cases uses a logarithmic scale. The reason is that the device in question responds exponentially to its independent variable. A lot of detail in its lower range would be missed if a linear scale were used instead.
-Phil
Phil,
Is that a reply to me? It seems to answer no-one's question though.
JRoark,
Yes, the minor divisions are linear tenths of the major divisions, that's why they visually map as log spacings on a log graph. Log tenths would be evenly spaced on a log graph. The term "integer" isn't a good choice here, btw.
I think I understand the discussion now. Your friend made an assumption and never tested it. Done that so many times myself.
Thats very helpful, Evan. I understood his point, but I didnt think it was correct. And yup, “integer” was a poor choice of words on my part.
Thats what I think as well. But you know, the spec sheet doesnt actually SAY HOW TO READ IT! I had to laugh at this a bit.
All: thanks for the discussion and guidance. As always, I learned something new.
Probably never will be on applied graphs. It's one of those taught-at-school things I'd say ... although I don't remember ever being taught it explicitly. Unlike the range, unit, and axis label, it is self explanatory if you know what to look out for.
It's intuitively obvious to anyone who's ever used a sliderule.")
-Phil
+1
")
Pickett 1010ES Rulez!!
These graphs are everywhere with analog electronics. There is no where to run, no where to hide.... Take a glance at any OP Amp data sheet.
What's that? A youtube video?")
But honestly Ive never used one. Was taught how an abacus works in school, but not a slide rule
-- After Noah let the animals go from the ark, he noticed that two of the snakes were not breeding. His son made a wooden table from tree trunks, put the snakes on the table, and they immediately started copulating. Noah asked his son how he knew that would happen. His son responded “Even an adder can multiply on a log table.” --
This thread has devolved rather wonderfully. And I totally approve! 🤣
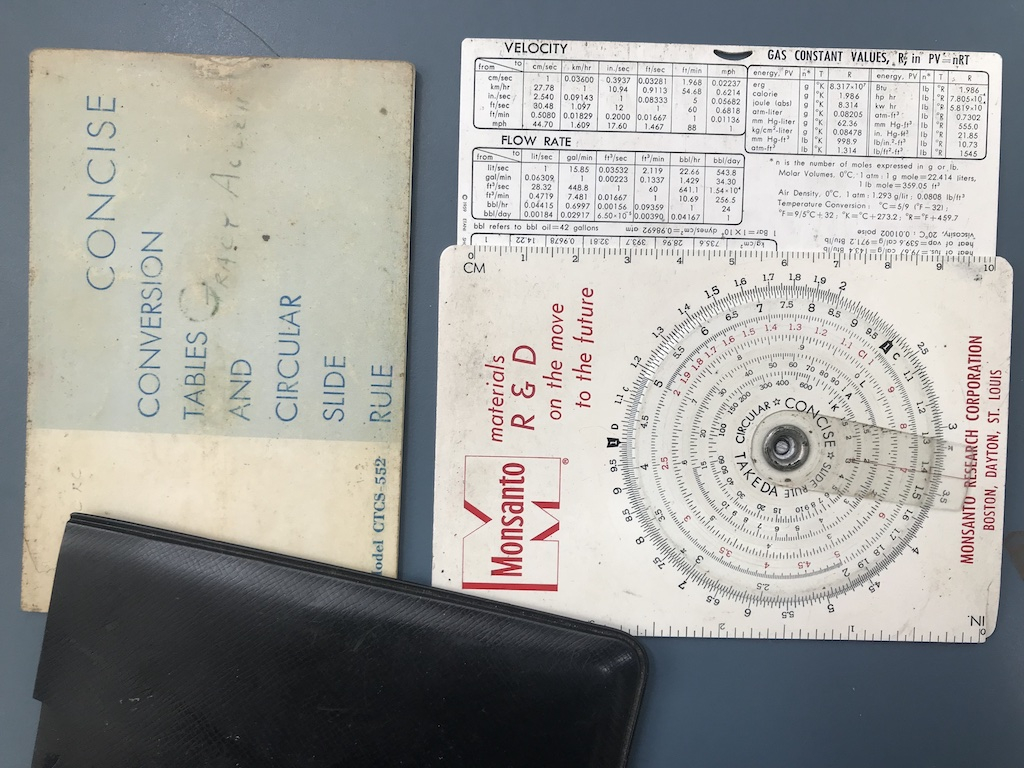
This is a compact pocket slide rule that got me through high school. The usual scales for multiply, divide, square and cube powers and roots, and logarithms. Plus three sides full of conversion tables and a table of the elements. Couldn't very well sneak it into tests though.
He also said "whose idea to bring those darned woodpeckers?"