

Ken's Processing OFFER response...
 octetta
Posts: 127
octetta
Posts: 127
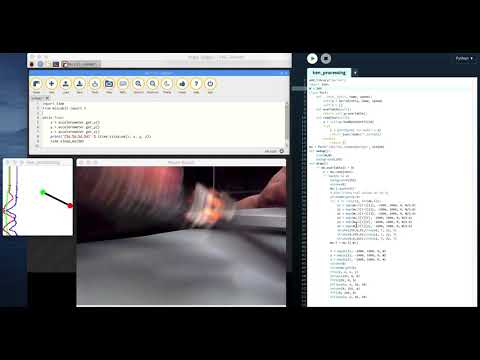
During Tuesday's P2 Zoom call, Ken challenged us to demonstrate something akin to what Chip's PropTool graphics can do using Python in mu-editor and the Processing.py platform.
Here's a SLOPPY entry, with the constraints:
1. Use micro:bit + mu-editor to write and compile code that generates data to graph (I used the built-in accelerometer) in 9 lines of Python.
2. Use Processing.py to acquire the data from the micro:bit via serial and graph it (I just made strip charts for x,y,z values and line graph of (z,x) to (x,y)) in 53 lines of Python.
Video on YouTube
Notes:
1. Processing.py is implemented in Java and presents the Jython implementation of Python which is a V2 variant (mu-python seems to be V3).
2. I couldn't get mu-editor to work well on my MacBook, so I installed it on a RPi and compiled/flashed there, then connected the micro:bit to the MacBook so it could talk to my Processing.py code via the USB serial port.
3. My Processing.py code has the serial port path hard-coded, it'll be different on every computer... Windows will probably be a COMx: designator, but I didn't have a Windows machine handy to check this.
4. Any suggestions on how to make this forum post show the YouTube preview directly, as well as how I insert screen captures w/o hosting the images somewhere are appreciated, the forum editor widgets were confusing to me.
5. I sent the readings from the micro:bit formatted in JSON to make parsing on the Processing.py side very simple and expandable.
Next steps:
Actually implement (some) of Chip's PropTool graphics modes, as this example just crammed a few line plots into one window... I'll post questions to him on the P2 section to learn more.
I'm thinking it might be nice to make a version of this using PyGame, since that presents a simple graphics model that has decent performance and it's "real" Python rather than the Jython that Processing.py uses.
If this is of any interest at all, I can clean it up and document how I did things...
-joe(octetta)
micro:bit code
Processing.py code
Here's a SLOPPY entry, with the constraints:
1. Use micro:bit + mu-editor to write and compile code that generates data to graph (I used the built-in accelerometer) in 9 lines of Python.
2. Use Processing.py to acquire the data from the micro:bit via serial and graph it (I just made strip charts for x,y,z values and line graph of (z,x) to (x,y)) in 53 lines of Python.
Video on YouTube
Notes:
1. Processing.py is implemented in Java and presents the Jython implementation of Python which is a V2 variant (mu-python seems to be V3).
2. I couldn't get mu-editor to work well on my MacBook, so I installed it on a RPi and compiled/flashed there, then connected the micro:bit to the MacBook so it could talk to my Processing.py code via the USB serial port.
3. My Processing.py code has the serial port path hard-coded, it'll be different on every computer... Windows will probably be a COMx: designator, but I didn't have a Windows machine handy to check this.
4. Any suggestions on how to make this forum post show the YouTube preview directly, as well as how I insert screen captures w/o hosting the images somewhere are appreciated, the forum editor widgets were confusing to me.
5. I sent the readings from the micro:bit formatted in JSON to make parsing on the Processing.py side very simple and expandable.
Next steps:
Actually implement (some) of Chip's PropTool graphics modes, as this example just crammed a few line plots into one window... I'll post questions to him on the P2 section to learn more.
I'm thinking it might be nice to make a version of this using PyGame, since that presents a simple graphics model that has decent performance and it's "real" Python rather than the Jython that Processing.py uses.
If this is of any interest at all, I can clean it up and document how I did things...
-joe(octetta)
micro:bit code
import time
from microbit import *

while True:
    x = accelerometer.get_x()
    y = accelerometer.get_y()
    z = accelerometer.get_z()
    print('[%d,%d,%d,%d]' % (time.ticks_ms(), x, y, z)) # JSON format array
    time.sleep_ms(50)
Processing.py code
add_library('serial')
import json
W = 200
class Port:
    def __init__(self, name, speed):
        self.p = Serial(this, name, speed)
        self.l = []
    def available(self):
        return self.p.available()
    def readjson(self):
        s = self.p.readBytesUntil(10)
        try:
            c = [chr(byte) for byte in s]
            return json.loads(''.join(c))
        except:
            return []
mu = Port('/dev/tty.usbmodem14102', 115200) # this is the path for the micro:bit on my machine... it'll be different on yours
def setup():
    size(W,W)
    background(255)
def draw():
    if mu.available() > 0:
        c = mu.readjson()
        if len(c) == 4:
            background(255)
            stroke(0)
            mu.l.append(c)
            # plot historical values on strip
            strokeWeight(1.5)
            for i in range(1, len(mu.l)):
                x1 = map(mu.l[i-1][1], -1000, 1000, 0, W/5.0)
                y1 = map(mu.l[i-1][2], -1000, 1000, 0, W/5.0)
                z1 = map(mu.l[i-1][3], -1000, 1000, 0, W/5.0)
                x2 = map(mu.l[i][1], -1000, 1000, 0, W/5.0)
                y2 = map(mu.l[i][2], -1000, 1000, 0, W/5.0)
                z2 = map(mu.l[i][3], -1000, 1000, 0, W/5.0)
                stroke(255,0,0);line(x1, i, x2, i)
                stroke(0,255,0);line(y1, i, y2, i)
                stroke(0,0,255);line(z1, i, z2, i)
            mu.l = mu.l[-W:]

            x = map(c[1], -1000, 1000, 0, W)
            y = map(c[2], -1000, 1000, 0, W)
            z = map(c[3], -1000, 1000, 0, W)
            stroke(0)
            strokeWeight(5)
            line(z, x, x, y)
            stroke(255, 0, 0)
            fill(255, 0, 0)
            ellipse(z, x, 10, 10)
            stroke(0, 255, 0)
            fill(0, 255, 0)
            ellipse(x, y, 10, 10)
Comments
Thanks Roy... I put a rambling response on that thread. I can take this a million different directions so any suggestions on how to "play well with others" is appreciated.
-joe
Thanks Tubular. I spent more time finding a micro:bit locally than actually writing code... unfortunately Frys only had a 10-pack of micro:bits, so I have spares if anyone needs one.
I've really appreciated the open and friendly nature of the community here, but I've been a lurker/leacher here for many years. I'd like to pay back the good will!
-joe
Ken