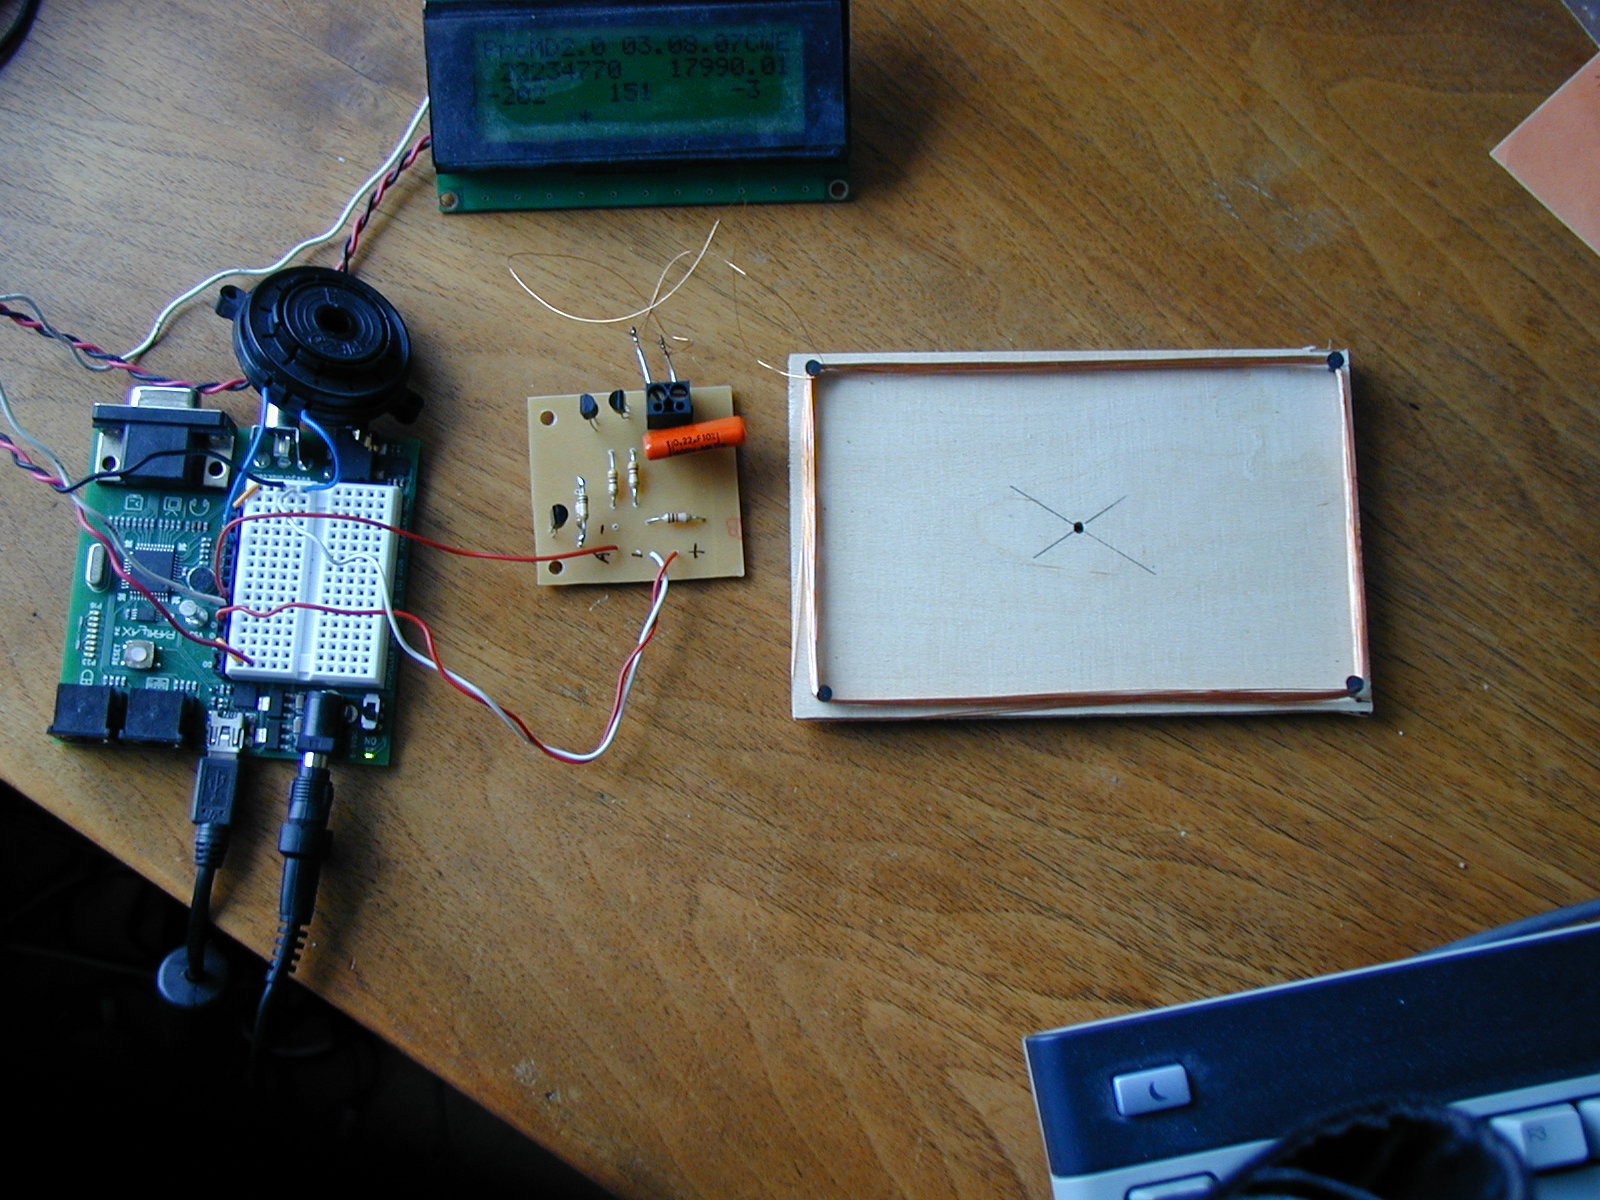
Metal detector uses Propeller, active LC generator, high-resolution frequency c
Hi,
ist this a "completed project" ? At least to some extend for me.... Perhaps this is interesting for others.
I was amazed of the simplicity of the metal detector of the Kit Lab Series.
See: http://forums.parallax.com/forums/default.aspx?f=25&m=202898&g=203382#m203382
Beau, if you read this post, I thought counters and frequency measurement is a specific strength of the prop. ADC is limited. Therefore I decided to use an active generator and no filters.
The statistical method "Doppel- Sigma- Detector" is used to find small deviations in data with noise using dynamic limits. The link describes the method to find pollution in water. I thought, that this might be interesting for other sensor data too?
http://www.umweltbundesamt.de/anlagen/EASE/german/auftest.htm
Frequency input at PIN 1 will be measuered.
There is an active frequency generator (18kHz) connected, which uses an LC-circuit, that will react to metals
neareby. (Oszill2.doc) A low frequency (<=18kHz) is needed to find the difference between ferrous and nonferrous metals.
The frequency counter actually gives the time in clock ticks for a given number (MCYCLES) of cycles.
This gives fast measurement with high resolution.
A statistics routine will calculate average and standard- deviation of the last NSAMPLES samples.
The beeper will sound after a significancy- test "Doppelsigma": the value has to be
consecutively twice out of limits, which are calculated dynamicly using the average of NSAMPLES samples plus/minus
a factor SFAK multiplied with the standard- deviation of the samples.
The LCD-display shows:
1st row: TITEL
2nd row: Average tics, actual frequency (float)
3rd row: Difference of the actual tics to the average; Standard- Deviation; something like a Log-value of the dif
4th: row: log-bargraph
Negative values of the difference show nonferrous, positive show steel
In Oszill2.doc there is the circuit of the generator. The generator reacts to small temperature differences.
The sensivity is now at least:
110mm for a bolt M8*40 mm
95mm for a coin 2 Euro
For this you need a noise level at a standard deviation of tics for 5000 cycles = 45/2240000 = 0.0002% (!) The frequency-shift caused by the metall is really very small!
At last some questions:
* Does anyone know a method to improve the temperature stability of the LC frequency-generator?
* Is anyone working on similar projects?
Have fun and find all that gold! (In this case, this icon means: don't tell the others how and where to find the g...)
Christof
ist this a "completed project" ? At least to some extend for me.... Perhaps this is interesting for others.
I was amazed of the simplicity of the metal detector of the Kit Lab Series.
See: http://forums.parallax.com/forums/default.aspx?f=25&m=202898&g=203382#m203382
Beau, if you read this post, I thought counters and frequency measurement is a specific strength of the prop. ADC is limited. Therefore I decided to use an active generator and no filters.
The statistical method "Doppel- Sigma- Detector" is used to find small deviations in data with noise using dynamic limits. The link describes the method to find pollution in water. I thought, that this might be interesting for other sensor data too?
http://www.umweltbundesamt.de/anlagen/EASE/german/auftest.htm
Frequency input at PIN 1 will be measuered.
There is an active frequency generator (18kHz) connected, which uses an LC-circuit, that will react to metals
neareby. (Oszill2.doc) A low frequency (<=18kHz) is needed to find the difference between ferrous and nonferrous metals.
The frequency counter actually gives the time in clock ticks for a given number (MCYCLES) of cycles.
This gives fast measurement with high resolution.
A statistics routine will calculate average and standard- deviation of the last NSAMPLES samples.
The beeper will sound after a significancy- test "Doppelsigma": the value has to be
consecutively twice out of limits, which are calculated dynamicly using the average of NSAMPLES samples plus/minus
a factor SFAK multiplied with the standard- deviation of the samples.
The LCD-display shows:
1st row: TITEL
2nd row: Average tics, actual frequency (float)
3rd row: Difference of the actual tics to the average; Standard- Deviation; something like a Log-value of the dif
4th: row: log-bargraph
Negative values of the difference show nonferrous, positive show steel
In Oszill2.doc there is the circuit of the generator. The generator reacts to small temperature differences.
The sensivity is now at least:
110mm for a bolt M8*40 mm
95mm for a coin 2 Euro
For this you need a noise level at a standard deviation of tics for 5000 cycles = 45/2240000 = 0.0002% (!) The frequency-shift caused by the metall is really very small!
At last some questions:
* Does anyone know a method to improve the temperature stability of the LC frequency-generator?
* Is anyone working on similar projects?
Have fun and find all that gold!
 (In this case, this icon means: don't tell the others how and where to find the g...)
Christof


Comments
I have studied the photos, objects and the schematic for the metal detector, but see no description of the actual inductor data. Does anyone know coil dimensions, wire size, and number of turns. Looks quite interesting.
http://forums.parallax.com/showthread.php?95883-Metall-Detector-modified-from-Edu-Kit-uses-some-Statitistics-But-how-to-find-G
The coil was 8*12cm, 30 windings 0,2mm wire. Sorry for the very late response....
Christof