

Detecting a collision with the MX2125
 Mightor
Posts: 338
Mightor
Posts: 338
Hi there,
I am trying to equip my bot with the MX2125 setup as a collision detector, rather than a series of microswitches or IR detectors. I copied and tweaked a program from the Smart Sensors book to do some data logging so I could see what it looked like if I bumped the bot as it stood stationary on my desk.
This is the program I used:
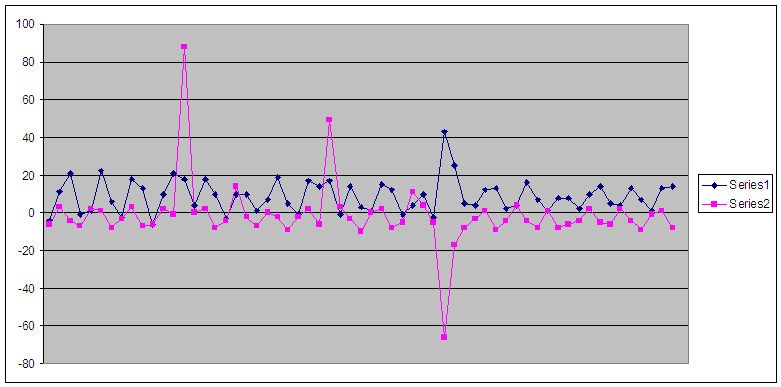
It produced the graph as attached to this post. You can clearly see the spikes from when I tapped the front of the bot but note the mirrored spikes, about 2/3rd of the way. That's when I tapped the left front corner of the bot.
Now what I'd like to do is somehow use this data that I am logging to detect when the bot bumps into something. I can calculate the direction the bump was coming from using the data from the MX2125. However, I am not sure how I would discern between the bot going up a ramp or hitting something. Are there algorithms out there that can detect this kind of thing? Basically I need something that can detect spikes but will leave gradual increases alone. Does anyone have any ideas how this could be implemented?
Thanks,
Mightor
▔▔▔▔▔▔▔▔▔▔▔▔▔▔▔▔▔▔▔▔▔▔▔▔
| What the world needs is more geniuses with humility, there are so few of us left.
I am trying to equip my bot with the MX2125 setup as a collision detector, rather than a series of microswitches or IR detectors. I copied and tweaked a program from the Smart Sensors book to do some data logging so I could see what it looked like if I bumped the bot as it stood stationary on my desk.
This is the program I used:
'{$STAMP BS2}
'{$PBASIC 2.5}
total CON 240
x VAR Word
y VAR Word
index VAR Word
FREQOUT 1, 50, 4500
FOR index = 0 TO total STEP 4
  PULSIN 6, 1, x
  PULSIN 7, 1, y
  x = (x MIN 1875 MAX 3125) - 2500
  y = (y MIN 1875 MAX 3125) - 2500
  WRITE index, Word x, Word y
  PAUSE 100
NEXT
FREQOUT 1, 50, 4500
FOR index = 0 TO total STEP 4
  READ index, Word x, Word y
  DEBUG SDEC4 x, " ", SDEC4 y, CR
NEXT
It produced the graph as attached to this post. You can clearly see the spikes from when I tapped the front of the bot but note the mirrored spikes, about 2/3rd of the way. That's when I tapped the left front corner of the bot.
Now what I'd like to do is somehow use this data that I am logging to detect when the bot bumps into something. I can calculate the direction the bump was coming from using the data from the MX2125. However, I am not sure how I would discern between the bot going up a ramp or hitting something. Are there algorithms out there that can detect this kind of thing? Basically I need something that can detect spikes but will leave gradual increases alone. Does anyone have any ideas how this could be implemented?
Thanks,
Mightor
▔▔▔▔▔▔▔▔▔▔▔▔▔▔▔▔▔▔▔▔▔▔▔▔
| What the world needs is more geniuses with humility, there are so few of us left.
781 x 387 - 15K
Comments
▔▔▔▔▔▔▔▔▔▔▔▔▔▔▔▔▔▔▔▔▔▔▔▔
- Stephen
I plotted the X and Y displacement values and then added the total distance from the origin. What came out was quite interesting. The collisions really stand out now from the background noise from the sensor. I have not tested this with the standard noise you get from running the bot on a normal floor, but this probably something I can use. The formula I used to calculate the distance from origin is SQRT(X^2+X^2). I am sure if I calibrated my X and Y values a bit better than merely subtracting 2500 to get a 0-point value I would get a much better peak.
As for it not being polite to bump into things, it is better to be prepared for the unlikely event your other sensors do not pick it up than to not be able to handle it at all [noparse]:)[/noparse] Nothing is more impolite than a robot that doesn't know when to stop trying to ride up your leg! This is more of an exercise in how to detect certain events than something that would actually end up in a robot I would use to traverse a maze, for example.
Gr,
Mightor
▔▔▔▔▔▔▔▔▔▔▔▔▔▔▔▔▔▔▔▔▔▔▔▔
| What the world needs is more geniuses with humility, there are so few of us left.
As a first cut, try adding some code that keeps a running average of the measurements. The collision detection code can then compare a potential collision event to, say, an average of the last ten measurements.
Andy
P.S. This is a really cool project!
▔▔▔▔▔▔▔▔▔▔▔▔▔▔▔▔▔▔▔▔▔▔▔▔
Andy Lindsay
Education Department
Parallax, Inc.
I'll second that!! neat project!! I think you are on the right track by taking the Delta from one sample to the next. This value should be directly proportional to acceleration/deceleration or·in your case as an "impact".
A·higher Delta value would translate to a more forceful impact. Normal acceleration/deceleration could be filtered out simply by setting a threshold value.
▔▔▔▔▔▔▔▔▔▔▔▔▔▔▔▔▔▔▔▔▔▔▔▔
Beau Schwabe
IC Layout Engineer
Parallax, Inc.
▔▔▔▔▔▔▔▔▔▔▔▔▔▔▔▔▔▔▔▔▔▔▔▔
Andy Lindsay
Education Department
Parallax, Inc.
Post Edited (Andy Lindsay (Parallax)) : 6/18/2007 4:07:18 AM GMT
'{$STAMP BS2}
'{$PBASIC 2.5}
total     CON    512
dataptr   VAR    Word
avgBy     CON    4
x         VAR    Word
y         VAR    Word
tmpdist   VAR    Word
dist      VAR    Word(avgBy)
avgdist   VAR    Word
avgCount  VAR    Word
index     VAR    Nib
FREQOUT 1, 50, 4500

' set all values to 0
FOR index = 0 TO avgBy - 1
  dist(index) = 1
NEXT

PAUSE 3000
FREQOUT 1, 50, 4500
FREQOUT 1, 50, 2000
index = 0
'FOR dataptr = 0 TO total STEP 8
DO
  PULSIN 6, 1, x
  PULSIN 7, 1, y
  x = (x MIN 1875 MAX 3125) - 2500
  y = (y MIN 1875 MAX 3125) - 2500

  avgdist = 0
  FOR avgCount = 0 TO avgBy - 1
    avgdist = avgdist + dist(avgCount)
  NEXT
  avgdist = avgdist / 4
  tmpdist = SQR ((X * X) + (Y * Y))

  'WRITE dataptr, Word x, Word y, Word avgdist, Word tmpdist

  IF ABS (tmpdist - avgdist) < 70 THEN
    dist(index) = tmpdist
    index = (index + 1) // avgBy
  ELSE
    FREQOUT 1, 50, 3000
    PAUSE 3000
  ENDIF
  PULSOUT 13, 850
  PULSOUT 12, 650
  PAUSE 20
LOOP
'NEXT

FREQOUT 1, 100, 2000

'FOR dataptr = 0 TO total STEP 8
'  READ dataptr, Word x, Word y, Word avgdist, Word tmpdist
'  DEBUG SDEC x, ",", SDEC y, ",", DEC avgdist, ",", DEC tmpdist, CR
'NEXT
You can tell by the way I have commented out certain parts that this was to allow me to run and do audible inspection of when a collision was detected. I have a living room covered in nice stone tiles so this is *really* throwing off my collision detection [noparse]:)[/noparse] I've been tweaking with the max spike value (70 in this code), but I am sure someone in a room with NO tiles would not suffer from this problem and could use something closer to 30 or so. Please note that this code is not optimised as much as I am sure it can be.
If you uncomment the bits that do the datalogging and the comment out the motor control lines, you can run the program on your table top and get the values in the debug window in a nice CSV format. To get simulated collisions, just tap the bot on its side, etc. You will notice differently shaped spikes in your graphs, but the total displacement value will always be high. You could use the X and Y values to calculate the angle from which the collision came, the displacement is basically just the hypotenuse. The bot's response could be tailored to these values.
Things that I still need to implement include a way to temporarily disable the shock detection when the bot is changing direction or starting up as I found that I get beeps whenever that happens.
I have included the graph and example csv file for your dataplotting pleasure.
Gr,
Mightor
▔▔▔▔▔▔▔▔▔▔▔▔▔▔▔▔▔▔▔▔▔▔▔▔
| What the world needs is more geniuses with humility, there are so few of us left.
Thinking about this a little further, if you convert the Cartesian coordinate values to polar coordinates you are left with an angle·and magnitude value.
Monitor the magnitude above a certain threshold to detect a collision, and look at the angle to determine direction. <--180 degrees out of phase from there should give you the location of·impact.
·
▔▔▔▔▔▔▔▔▔▔▔▔▔▔▔▔▔▔▔▔▔▔▔▔
Beau Schwabe
IC Layout Engineer
Parallax, Inc.
Here is an interesting "window averaging/tracking" technique that might be of interest.
....The only stipulation is that for what ever series of numbers you introduce, the Result
of multiplying the Number of Samples by the MAXimum InputData value does not exceed 65535.
Also your data InputData value must be a positive number.
That means for a InputData value that stays within a NIBBLE, you could have a maximum of
4096 Samples representing your average. A BYTE would allow for 256 Samples.
For yor current code, since your highest value for X or Y is limited to +/- 625 ...
...You will need to scale it so that it remains positive.· To do this just add 625, so now it ranges from 0 to 1250
When looking at the average, simply subtract 625 to reconstruct·the signed value.
With a "high" value of only 1250, you could 'fit' about 52 averaged samples using the method below.
Maximum # of Samples = 65535 / 'MAXimum InputData value' =· 52.428 = 52
InputData ... defined as a WORD
DataBase ... defined as a WORD
Samples ... defined as a constant
Average ... defined as a WORD
MainLoop:
'Get value for InputData Here
DataBase = DataBase - Average + InputData
Average = DataBase / Samples
goto MainLoop
▔▔▔▔▔▔▔▔▔▔▔▔▔▔▔▔▔▔▔▔▔▔▔▔
Beau Schwabe
IC Layout Engineer
Parallax, Inc.
Post Edited (Beau Schwabe (Parallax)) : 6/18/2007 5:50:28 AM GMT
I am not sure I follow your window averaging/tracking algorithm. Could you explain it a bit more? How does this differ from the rolling average algorithm?
Gr,
Mightor
▔▔▔▔▔▔▔▔▔▔▔▔▔▔▔▔▔▔▔▔▔▔▔▔
| What the world needs is more geniuses with humility, there are so few of us left.
For distance or magnitude, you already have the formula.... for angle, check out the ATN function built into the BS2... You might need to scale your values down just a bit for the function to properly work, but for what you are doing and determining direction it should be adequate.·· ...If you want also check out the HYP function, that's basically your distance formula.
·
·
Initailly Average starts out as zero and DataBase starts out as zero. As the Input data propagates through the formula iteration after iteration, the result is a "running average Window" of your InputData.
Think of it this way, look at the formula....
DataBase = DataBase - Average + InputData
Average = DataBase / Samples
Normally if you have a DataBase that has accumulated the value of say 10 samples, then in order to find the average you would divide the database by 10 right?
...and that's basically what you see in the last line of the formula. Think about what would happen if the InputData value was relatively constant. You would expect the Average value to equal something very close to the InputData value. The First line basically skims off the top of the DataBase by subtracting the Average and replacing it with the InputData value. This way new data can be introduced to the system and you can maintain a "running average Window" of a fixed number of samples.
·
▔▔▔▔▔▔▔▔▔▔▔▔▔▔▔▔▔▔▔▔▔▔▔▔
Beau Schwabe
IC Layout Engineer
Parallax, Inc.
Post Edited (Beau Schwabe (Parallax)) : 6/18/2007 5:52:52 AM GMT
I was also reading up on polar coordinates and it seems I will need to scale down to -127 to +127 in order to be able to work with the ATN function. That will then also allow me to have a much larger number of samples for the averaging algorithm. Scaling down will also further dampen the low value rumble you get from running the bot. The spikes will still be big enough to stand out from the noise.
Shame I am in the office now, otherwise I'd be testing this out right now! I'll have to wait another 8 hours, hehe. I guess this is not something that would apply to your jobs. Your boss would probably think it weird if you're NOT messing around with robots in the office.
Gr,
Mightor
▔▔▔▔▔▔▔▔▔▔▔▔▔▔▔▔▔▔▔▔▔▔▔▔
| What the world needs is more geniuses with humility, there are so few of us left.
You should only need to scale down for the direction by a factor of 5.
I personally would leave the resolution that you currently have for·impact measurements.
"I have a living room covered in nice stone tiles so this is *really* throwing off my collision detection [noparse]:)[/noparse]"
This now becomes an issue or question... "Can my vehicle survive normal road terrain impact?"
Set a threshold level that you are comfortable with... Reduce the speed or get bigger tires [noparse]:o[/noparse]) ...Anything under threshold is considered fare game.
▔▔▔▔▔▔▔▔▔▔▔▔▔▔▔▔▔▔▔▔▔▔▔▔
Beau Schwabe
IC Layout Engineer
Parallax, Inc.
There's a proper model shop (for RC cars, boats, planes, copters, etc) with all the components a robot maker could dream of, in a town about 45 minute's drive from my house. I think I might pop down there to see what they have in lieu of air filled tires. Hopefully they have ones with spokes like the ones that come with the original Boe-Bot so I can continue to use my encoders.
A month ago I would never have guessed this robot building stuff was this creative.
Gr,
Mightor
▔▔▔▔▔▔▔▔▔▔▔▔▔▔▔▔▔▔▔▔▔▔▔▔
| What the world needs is more geniuses with humility, there are so few of us left.
'{$STAMP BS2}
'{$PBASIC 2.5}
total     CON    512
dataptr   VAR    Word
avgBy     CON    4
x         VAR    Word
y         VAR    Word
tmpdist   VAR    Word
dist      VAR    Word(avgBy)
avgdist   VAR    Word
avgCount  VAR    Word
index     VAR    Nib
database  VAR    Word
FREQOUT 1, 50, 4500

database = 4

PAUSE 3000
FREQOUT 1, 50, 4500
FREQOUT 1, 50, 2000
FOR dataptr = 0 TO total STEP 8
  PULSIN 6, 1, x
  PULSIN 7, 1, y
  x = (x MIN 1875 MAX 3125) - 2500
  y = (y MIN 1875 MAX 3125) - 2500

  avgdist = database / avgBy
  tmpdist = Y HYP X

  'WRITE dataptr, Word x, Word y, Word avgdist, Word tmpdist
  WRITE dataptr, Word avgdist, Word tmpdist
  IF ABS (tmpdist - avgdist) < 70 THEN
    database = database - avgdist + tmpdist
  ENDIF
  PULSOUT 13, 850
  PULSOUT 12, 650
NEXT

FREQOUT 1, 100, 2000

FOR dataptr = 0 TO total STEP 8
  READ dataptr, Word avgdist, Word tmpdist
  DEBUG DEC avgdist, ",", DEC tmpdist, CR
NEXT
Please note that no optimization has been done with regards to the number of vars. I did not have to readjust the offset of the X or Y values as I am using the total displacement in my averaging sum which is always positive (no such thing as a negative sized hypotenuse).
When I ran the bot on the tiles, I recorded quite massive displacements in the data. The tiles are pretty big, about 20x40cms and the grouting is quite wide. Check the distance-tiledfloor.png for more details (attached). The last spike is the bot colliding with a big immovable object.
I then placed the bot on a nice smooth surface, a 70x70cms big piece of plywood. The data shows no major displacement except when it finally hits the big object. See distance-smoothfloor.png for more details (attached).
Please note that in both graphs you see a big spike in the beginning. This is due to the robot accelerating from 0. Ideally you would stop logging whenever the bot is changing direction or accelerating.
With the tiled floor there is no real way to distinguish between a collision spike and entering or exiting a grout dip. A solution to this would be either to do additional checking on the speed of the robot. This could be done with the digital encoders. However, I noticed that slippage of the wheels would give false readings to the encoders, leading it to believe that is was still moving. The other solution would be air filled tires to dampen the grout induced vibrations.
I've also noticed that there is almost no time left to do much of anything else besides the logging without causing the servos to stutter. This would of course completely throw off any kind of logging you might want to do. If the logging is left out, you could do some rudimentary directional control. A faster variant of the Basic Stamp 2 would probably be able to overcome this limitation. I am using the standard Basic Stamp 2 which runs at a little under half the speed of a 2SX.
So there you go. If someone has other ideas as to how I could distinguish between hitting grout and a large immovable object I'd love to hear it!
Gr,
Mightor
▔▔▔▔▔▔▔▔▔▔▔▔▔▔▔▔▔▔▔▔▔▔▔▔
| What the world needs is more geniuses with humility, there are so few of us left.
·
Can you post the data you used in Excel?· ... and maybe the data for a couple more runs on the tile?
·
I see a pattern that might lead to a way to distinguish rough terrain from a collision, but more data is required fro this observation to be valid.
·
Basically if you set a threshold of say 100 or even 120·by your latest data and look at the "Actual", then there are three points or events of interest.
If you look at the "Average" value before (point #1) and after (Point #2) each of the three events and calculate the slope between the two points,
a rough terrain would produce a higher slope than a terrain that was not so rough.· The idea here is to use this slope value in a scaling technique
towards the "Actual" data.· A higher·slope would bump the Collision threshold slightly higher than a lower slope would allow.
·
The attached image might be more intuitive as far as what I am trying to describe.
▔▔▔▔▔▔▔▔▔▔▔▔▔▔▔▔▔▔▔▔▔▔▔▔
Beau Schwabe
IC Layout Engineer
Parallax, Inc.
Post Edited (Beau Schwabe (Parallax)) : 6/20/2007 3:12:13 AM GMT
As for the actual datafile, no, I don't have it anymore, so I went ahead and did another run. I have both the CSV file and the Excel sheet, so take your pick. The spikes are shaped slightly differently but I guess that's only normal.
Note that I don't have the X and Y values for reasons mentioned in my previous post: IC slowness and stuttering servos when logging too much data. The stuttering servos would most likely introduce even more excessive shaking and spikes.
Thanks for looking at this stuff, btw!
Gr,
Mightor
▔▔▔▔▔▔▔▔▔▔▔▔▔▔▔▔▔▔▔▔▔▔▔▔
| What the world needs is more geniuses with humility, there are so few of us left.
Gr,
Mightor
▔▔▔▔▔▔▔▔▔▔▔▔▔▔▔▔▔▔▔▔▔▔▔▔
| What the world needs is more geniuses with humility, there are so few of us left.
After your comments about the servos stuttering, I'm looking for some way to speed up the loop. Of course the biggest time hog is the PULSIN for the two Memsic axes. Each one of those takes up to 10 milliseconds. You already cut down on the number of readings in the WRITE to the log file. To recover a few of milliseconds more, it looks like the program could get by to log bytes instead of words, as the largest value I see in the data so far is 180. That could get larger with bigger g-forces, though. Also, no need to store dataptr as it is predetermined. The program has aroud 5 milliseconds after the end of the Y pulse, to do all its stuff and get back to catch the next PULSIN. It is a kind of lockstep timing issue. Too bad you can't take readings from X and Y in alternate passes through the loop. But for best accuracy on the HYP operator, they have to be practically simultaneous.
That got me to thinking. How is the MEMSIC mounted in the Bot, I mean, what orientation?
The largest reading I see is around 180 for the magnitude. Following the calculation in the data sheet, that amounts to around 288 milli-Gs. Is that right? (180 BS2 time units * 2 microseconds/ BS2 time unit = 360 microsecond deviation from center. 360 / 10 * 8 = 288.) I don't know what to make of it. I'm interested in whatever analysis Beau can come up with.
Have you tried a larger value of "avgBy", say 6 or 8? That would smooth out the average more. I was kind of worried by the term,
IF ABS (tmpdist - avgdist) < 70 THEN ... ' only allow averaging on small exursions
It seems to be working okay, but it might lock up in some more extreme conditions. I don't know. Maybe a failsafe term so as time passes without the condition being satisfied, the window gets larger.
▔▔▔▔▔▔▔▔▔▔▔▔▔▔▔▔▔▔▔▔▔▔▔▔
Tracy Allen
www.emesystems.com
I have never had a displacement value go above about 200. I think I'd probably cause damage to the frame if I did try because I had to hit the bot quite hard to get it to go that high. A Byte would probably suffice to hold the data.
As for taking more readings to calculate the average this is definitely a possibility. I will implement it this afternoon when I get home from the office. As for the value in the "IF ABS (tmpdist - avgdist) < 70 THEN" line, it was the average amount of displacement I found would give the fewest false positives when the bot was NOT moving and I would just tap the bot in various places to simulate a collision. It's been that value for a while now and would probably require readjustment now that I am doing tests on the tiles. However, a difference of 70 between the average and the actual value is quite a lot and a larger value might end up absorbing genuine collisions into the calculations. Experimenting some more will prove or disprove that [noparse]:)[/noparse]
Gr,
Mightor
▔▔▔▔▔▔▔▔▔▔▔▔▔▔▔▔▔▔▔▔▔▔▔▔
| What the world needs is more geniuses with humility, there are so few of us left.
I modified the program (see attached). I also attached all the data from the 8 runs that I did:
2 x Smooth surface, no collisions
2 x Smooth surface, collision
2 x Tiled surface, no collisions
2 x Tiled surface, collision
Modifications include:
* logging 2 bytes instead of 2 Words
* extensive comments
* average of 8 measurements instead of 4
Let me know if this is of any help. The first two sheets in the Excel contain the graphs, the others contain the raw data.
Gr,
Mightor
▔▔▔▔▔▔▔▔▔▔▔▔▔▔▔▔▔▔▔▔▔▔▔▔
| What the world needs is more geniuses with humility, there are so few of us left.
Yeah, this is tough... Forget the averaging, unless you use that for the general noise floor comparison.· The simple formula that I tried out basically looks at the magnitude value just before
a spike, and immediately afterwards upon the next sample.· From there it tries to determine a slope·between those two points ranging in value from 0 to 1.·
Threshold = 100

SlopeScale = 400


IF Actual > Threshold THEN

   IF Slope X SlopeScale < Actual THEN

      {Collision Detected}

   ELSE

      {Collision Not Detected}

   END IF

END IF


Slope: (Note: Slope value is delayed by one sample)

IF N1>N2 THEN

   Slope = N2/N1

ELSE

   Slope = N1/N2

END IF

Where N1 is 'Past Actual' (The previous reading of 'Actual')

Where N2 is 'Future Actual' (The next reading of 'Actual')
If there is·little difference between the two points, the slope value will be closer to 1 indicating that the vehicle is at least still moving.· A larger difference between the two points, the slope·value will be closer to 0 indicating that the vehicle has stopped (<--all be it momentarily)·or abruptly changed its direction.· The slope value is then used to scale a comparison against the Actual (RAW) data to determine a collision.
Based on this sort of thinking, it might be more intuitive to step back and take a look at just the raw sensor values without any calculation.· This way you can also derive values such as theta
implementing 'Delta Theta' transitions in addition to G strength comparisons.
·
▔▔▔▔▔▔▔▔▔▔▔▔▔▔▔▔▔▔▔▔▔▔▔▔
Beau Schwabe
IC Layout Engineer
Parallax, Inc.
Post Edited (Beau Schwabe (Parallax)) : 6/21/2007 5:34:57 AM GMT
That looks great, unfortunately I won't be able to try this out until tomorrow; I'm in the office now and this evening I'm having some people over. Damn those timezone differences (and social engagements) I was wondering what you used in Excel to create the collision detected line?
As for logging both X and Y as well, I don't think this is a problem. The values should fit inside a Byte, I have never seen them go beyond 200 or so and that's with a really violent jolt to the bot. If the hypotenuse fits inside one, the sides definitely should [noparse]:)[/noparse] Seeing as logging 2 Words went without a hitch, I can't see 4 Bytes running into issues. I will have the data for you tomorrow.
Could you explain to me what you mean by "theta" values? Is this the angle at which the impact occurred? I wouldn't want to assume that impacts always happen from the front, they could come in from the side as well. I suppose seeing as the wheels are in a fixed position, the "shockwave" produced by them getting hit would always come from roughly the same angles; practically 90 degrees on each side of the sensor.
Who knew crashing things was this much fun?
Gr,
Mightor
▔▔▔▔▔▔▔▔▔▔▔▔▔▔▔▔▔▔▔▔▔▔▔▔
| What the world needs is more geniuses with humility, there are so few of us left.
See attached image ... look in the cell edit window
"Could you explain to me what you mean by "theta" values? Is this the angle at which the impact occurred?"
Yes
"I wouldn't want to assume that impacts always happen from the front, they could come in from the side as well. I suppose seeing as the wheels are in a fixed position, the "shockwave" produced by them getting hit would always come from roughly the same angles; practically 90 degrees on each side of the sensor."
Any impact even side impacts should produce a detectable result.·
▔▔▔▔▔▔▔▔▔▔▔▔▔▔▔▔▔▔▔▔▔▔▔▔
Beau Schwabe
IC Layout Engineer
Parallax, Inc.
I bet a 3D inclinometer detector would be a lot more useful in this case. A collision would produce a vector at an almost horizontal plane, but going in and out of the grout would produce one at a much more vertical angle (down or up, depending on whether the bot is going in or out of the grout). Unfortunately I don't have one so I guess we'll have to make do with the MX2125 [noparse]:)[/noparse]
Gr,
Mightor
▔▔▔▔▔▔▔▔▔▔▔▔▔▔▔▔▔▔▔▔▔▔▔▔
| What the world needs is more geniuses with humility, there are so few of us left.
Apologies for the delay, real life stuff crept up so I didn't get around to getting the data you needed. However, I have it now. I recorded theta, current and average displacement. I couldn't record the raw values of X and Y because that would've made the servos stutter (I tested it).
Please note that theta is in BRADS, this is what ATN outputs by default and I didn't want to do any more maths on the stamp than I really needed to.
From run 3 onwards you can see how theta seems to undulate very regularly. This must be due to the motion of the wheels.
In run 4 my bot ran off the smooth surface and onto another smooth surface, so the spike towards the end of that run can be ignored as it shouldn't have happened [noparse]:)[/noparse]
I am not sure how to plot theta somehow onto the rest of the data so you can compare it. I am hoping you have a better idea.
Gr,
Mightor
Edited: added new source code, added (fuzzy) picture to show sensor orientation. Apologies for the terrible quality, I blame my Zire 72.
▔▔▔▔▔▔▔▔▔▔▔▔▔▔▔▔▔▔▔▔▔▔▔▔
| What the world needs is more geniuses with humility, there are so few of us left.
Post Edited (Mightor) : 6/23/2007 7:51:02 AM GMT
When I ran it again with the bot on the window sill, I found the values to be a LOT more stable. I think with a setup like this you could probably detect a bird passing wind in a tree 100m away.
I attached the xls file with the raw values and the charts which have been attached as pngs as well (for those who don't have/won't use Excel).
Gr,
Mightor
▔▔▔▔▔▔▔▔▔▔▔▔▔▔▔▔▔▔▔▔▔▔▔▔
| What the world needs is more geniuses with humility, there are so few of us left.
No need to apologize... The latest data (robot-runs-theta.zip) is the most compelling as far as trying to discriminate a collision vs. noise.
"I am not sure how to plot theta somehow onto the rest of the data so you can compare it. I am hoping you have a better idea."
All you need to do is plot the difference or change in theta. It doesn’t really matter what direction your going or if it's in BRADS, DEG's, or
whatever, the main thing is to look for change, and how big that change is..... Delta theta = ABS(previous Sample - current Sample)
The attachment I have included has four series of data for each of the 6 runs .... Average (Series 1) ; Current (Series 2) ; Delta theta (Series4) .... Ignore Series 3 (Empty Column)
Something to note: Each time a collision occurs, 'Delta theta' gets dramatically knocked down for at least 3 to 4 samples during/after the event.
It's a definite window to look for based on the current data that has been made available.
BTW) I think that your columns for Average and Current in the last data set you provided are swapped with each other.
▔▔▔▔▔▔▔▔▔▔▔▔▔▔▔▔▔▔▔▔▔▔▔▔
Beau Schwabe
IC Layout Engineer
Parallax, Inc.
I think I may have an explanation for the delta theta being knocked down for a while after a collision. I think it is due to the bot's servos still running but the bot not moving. That would cause a pretty consistent displacement from a very particular angle.
Btw, think the way I've been handling the delta theta is a bit wrong. Say I have a theta of 250 brads and 5 brads. Now normally you would get a delta of 245 brads. However, if you look at it from the other direction, you'd only get a delta of 10 brads. In theory we should never have a delta of more than 128 brads.
I will work on implementing this on the bot and will post the data file soonest.
Gr,
Mightor
▔▔▔▔▔▔▔▔▔▔▔▔▔▔▔▔▔▔▔▔▔▔▔▔
| What the world needs is more geniuses with humility, there are so few of us left.
Your absolutely right! .... Delta Theta should be something like this ....
Delta theta = ABS(previous Sample - current Sample)
IF Delta theta > 128 then
    Delta theta = 255 - Delta theta
END IF
...I re-ran the data, but I feel as though the data is only allowing us to see half a dozen of one thing and six of another. At this point in order to derive anything from the data... Delta, average, whatever, nothing but the raw X and Y values should be logged. Throwing other stuff in there at the moment does not necessarily help things. I have modified your Collision detection program
so that it will acquire 192 samples for X and Y (See attached)
▔▔▔▔▔▔▔▔▔▔▔▔▔▔▔▔▔▔▔▔▔▔▔▔
Beau Schwabe
IC Layout Engineer
Parallax, Inc.
I downloaded your code and modified it so it would log X and Y as Word-sized vars to make sure it got logged completely.
I slapped all the data into an Excel sheet but I am getting quite a few /0 errors, hehe. I am by no means an Excel wizard and as it's close to 11pm here, my brain is slowly starting to melt.
I've attached the Excel sheet with the raw X and Y data, as well as theta (I hope I got the right formula for this one) and the displacement. I'll have a better look tomorrow morning and see if I can't extract some more info out of this.
Btw, I really appreciate you putting so much time and effort into helping me figure this out!
Gr,
Mightor
▔▔▔▔▔▔▔▔▔▔▔▔▔▔▔▔▔▔▔▔▔▔▔▔
| What the world needs is more geniuses with humility, there are so few of us left.