

Fill in data on exponential curve
 metron9
Posts: 1,100
metron9
Posts: 1,100
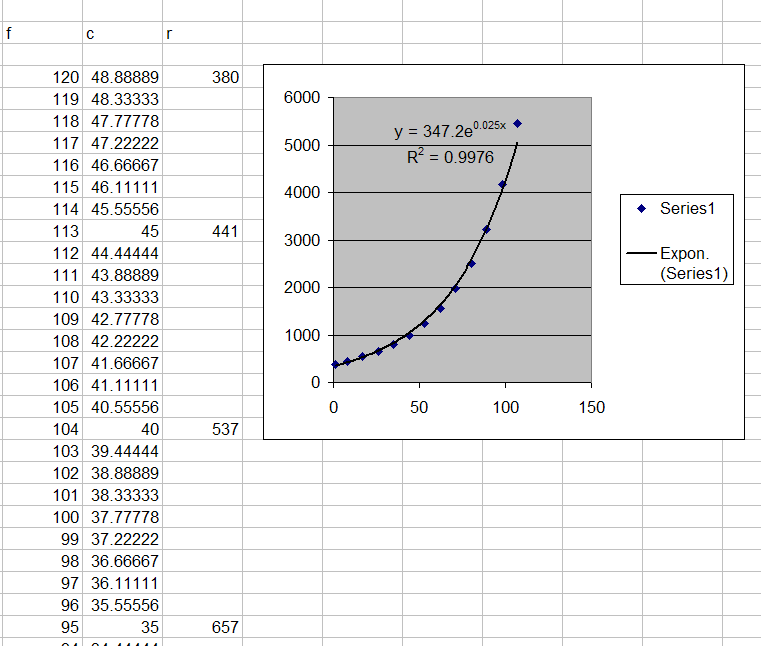
I see how to add an exponential line to a series of data points, but how do you have it fill in the missing points on the worksheet?
I have the two formulas on the chart but I don't know how to use them to fill in the data.
This is a thermistor I am using for 20 to 120 degrees F. The datapoints I have are in 5 degree C steps.
▔▔▔▔▔▔▔▔▔▔▔▔▔▔▔▔▔▔▔▔▔▔▔▔
Think Inside the box first and if that doesn't work..
Re-arrange what's inside the box then...
Think outside the BOX!
761 x 646 - 27K
Comments
A Stamp might be a bit stressed at these calcs in real-time processing, but I've used a look-up table quite successfully.
Also, the OMEGA Engineering website, in the temperature section, has some useful formulas for linearizing the thermistor values which might also help out.
Cheers
▔▔▔▔▔▔▔▔▔▔▔▔▔▔▔▔▔▔▔▔▔▔▔▔
Tom Sisk
http://www.siskconsult.com
·
Stamptrol, I see the formulas but I don't know how to use the formula to fill in the blank spaces in the resistance column. As you can see Resistance starting at 380ohms at around 49.8C and 441ohms at 45C The spaces between 45C and 49.8C I want to fill. I would then convert to integers and create a lookup table.
I will check the omega site as well but I just need an example of how to use the formula on the chart to fill in the blank resistance values.
▔▔▔▔▔▔▔▔▔▔▔▔▔▔▔▔▔▔▔▔▔▔▔▔
Think Inside the box first and if that doesn't work..
Re-arrange what's inside the box then...
Think outside the BOX!
Two things stand out inthe graph compared to the data:
1. from points you already know, the lower the temp, the higher the resistance. The curve (assuming temp on the bottom or x-axis) shows the opposite. Maybe just from how the print was specified (or are those numbers from an RCTIME function?)
2. Again, from the points you do know, your interest is in the 0 to 1000 range, not all the way to 6000. If you re-plot to a narrower range ( say 0 -1000 for Y, 0 to 50 for X, you could almost pick r values right off the curve for any temp.
The other thing about your area of interest is that you could actually set up a test in a small temperature controlled box and compare your thermistor readings to a old-fashioned thermometer.
Hope this helps.
▔▔▔▔▔▔▔▔▔▔▔▔▔▔▔▔▔▔▔▔▔▔▔▔
Tom Sisk
http://www.siskconsult.com
·
In the picture we know the values that are missing shown in the previous column. It is simply multiplying each number by two.
We see the formula y = e 0.6931x
Now the box under the number 2 should be the number 4, under that should be 8 then 16 and then the 32 is there
I am a blockhead in math so in the box under the 2 we type exactly what to make the box show the number 4.
Without the formula I generated the numbers with =G32*2 where g32 is the cell that contains the 2
That formula has nothing to do with e 0.6931x
see what i mean I am a blockhead.
▔▔▔▔▔▔▔▔▔▔▔▔▔▔▔▔▔▔▔▔▔▔▔▔
Think Inside the box first and if that doesn't work..
Re-arrange what's inside the box then...
Think outside the BOX!
Don't be so hard on yourself!
The x-axis of your new graph is the "number of the entry"; like the third entry should be 8: e^.696*3= 8
or, what does the 10th entry give you? e^.693*10= 1022 (close enough for gov't work)
Or, look at your graph. What is the y number when x= 12.5? e^.693*12.5= 5782
Cheers
▔▔▔▔▔▔▔▔▔▔▔▔▔▔▔▔▔▔▔▔▔▔▔▔
Tom Sisk
http://www.siskconsult.com
·
I don't really know what an exponent is it's not in my vocabulary, rather wasn't. I have done some reading and I understand what an exponent is now.
I can now fill in the blanks, thank you very much for bearing with me. When it comes to symbols in math problems my brain refuses to interpret them. That's why I have a hard time with assembler in the SX but no such problem in assembler that does not require signs like #!. although % and $ are comfortable for binary and hex numbers.
I watched my brother in law do the exponential chart on excell once (he's an EE) so I knew how to make the line, now I know the rest. Thanks again.
▔▔▔▔▔▔▔▔▔▔▔▔▔▔▔▔▔▔▔▔▔▔▔▔
Think Inside the box first and if that doesn't work..
Re-arrange what's inside the box then...
Think outside the BOX!