

Propeller Application: Bode Plotter (Frequency vs. Magnitude)
 Beau Schwabe
Posts: 6,576
Beau Schwabe
Posts: 6,576
Here is another taste of what the Propeller is capable of with only a few (5) external components added to a demo board.
This project is to be used as a tool much like an oscilloscope, instead this will allow you to do Bode Plots right to your TV.
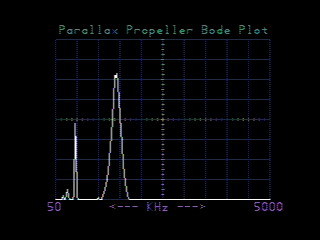
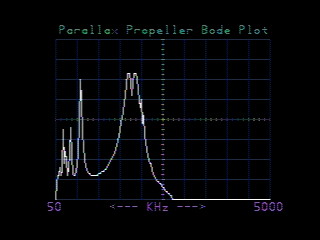
The example program sweeps the frequency from 50kHz to 5MHz, but is capable of going from DC to 125MHz.
The screen represents a resolution of 200 points from Left to Right (247.5kHz per division) <--(5MHz - 50kHz)/20
The captured video clip simply shows the frequency response of a 100uH coil in series with an adjustable capacitor over
the range of 50kHz to 5MHz as I am manually adjusting the capacitor..
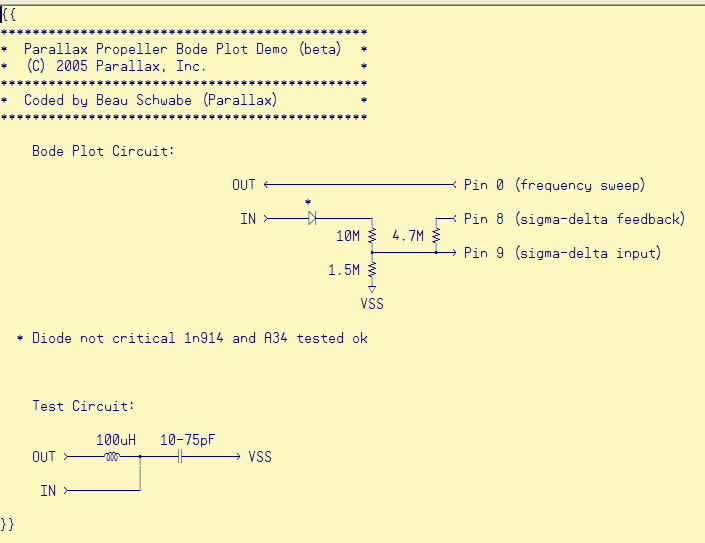
BodePlot.jpg - 10M/1.5M input voltage divider ratio on the input
BodePlot2.jpg - 10M/2.5M input voltage divider ratio on the input
▔▔▔▔▔▔▔▔▔▔▔▔▔▔▔▔▔▔▔▔▔▔▔▔
Beau Schwabe
IC Layout Engineer
Parallax, Inc.
Post Edited (Beau Schwabe (Parallax)) : 4/5/2006 5:17:56 PM GMT
This project is to be used as a tool much like an oscilloscope, instead this will allow you to do Bode Plots right to your TV.
The example program sweeps the frequency from 50kHz to 5MHz, but is capable of going from DC to 125MHz.
The screen represents a resolution of 200 points from Left to Right (247.5kHz per division) <--(5MHz - 50kHz)/20
The captured video clip simply shows the frequency response of a 100uH coil in series with an adjustable capacitor over
the range of 50kHz to 5MHz as I am manually adjusting the capacitor..
BodePlot.jpg - 10M/1.5M input voltage divider ratio on the input
BodePlot2.jpg - 10M/2.5M input voltage divider ratio on the input
▔▔▔▔▔▔▔▔▔▔▔▔▔▔▔▔▔▔▔▔▔▔▔▔
Beau Schwabe
IC Layout Engineer
Parallax, Inc.
Post Edited (Beau Schwabe (Parallax)) : 4/5/2006 5:17:56 PM GMT

Comments
Way cool Beau! Can't wait until summer to play more!
-Martin
▔▔▔▔▔▔▔▔▔▔▔▔▔▔▔▔▔▔▔▔▔▔▔▔
Martin Hebel
Southern Illinois University Carbondale - Electronic Systems Technologies
Personal Links with plenty of BASIC Stamp info
StampPlot - Graphical Data Acquisition and Control
▔▔▔▔▔▔▔▔▔▔▔▔▔▔▔▔▔▔▔▔▔▔▔▔
"When all think alike, no one is thinking very much.' - Walter Lippmann (1889-1974)
······································································ Warm regards,····· G. Herzog [noparse][[/noparse]·黃鶴 ]·in Taiwan
Post Edited (Kramer) : 4/1/2006 11:43:56 AM GMT
The displayed bandwidth could actually be better. The current program only samples 200 points (bytes) and displays them
directly on the screen. With 50KHz to 5MHz, the program calculates the step interval to be 24.75 kHz. (5MHz - 50kHz) / 200
Since I am only using "bytes" I can store at least 1000 instead of 200 if I wanted to and display a "window" of the data, making
this a "Storage Bode Plot". With 1000 sample points, I could get a 4.95kHz sampling resolution with the current sweep. You
could also narrow the sweep window to get even more precision. Keep in mind, it does not have to be from 50Khz to 5MHz.
With a little bit of external memory, you could pretty much pick your own bandwidth. The difference between an oscilloscope
vs. a Bode plot, is that an oscilloscope functions in the time domain, where a Bode plot functions in the frequency domain. What
is nice, is that you can spend as much "time" as you want to at each frequency point to collect the data/histogram.
▔▔▔▔▔▔▔▔▔▔▔▔▔▔▔▔▔▔▔▔▔▔▔▔
Beau Schwabe
IC Layout Engineer
Parallax, Inc.
Post Edited (Beau Schwabe (Parallax)) : 4/1/2006 1:57:18 PM GMT
Your front-end of the 100 uH and varicap make it sensitive to the·50k to 5 meg·range; I guess with a suitable choice of components the frequency range can be varied; I wonder: what will it take to get me to 2.4ghz? The brains of a spectrum analyzer on-a a-chip? And switch in various RF front ends for·ranges...Boggle, boggle...
WAY cool, as Martin asserts!
Jim
▔▔▔▔▔▔▔▔▔▔▔▔▔▔▔▔▔▔▔▔▔▔▔▔
In the end, it seems that it's all about getting the LEDs to blink....
"I guess with a suitable choice of components the frequency range can be varied"
Yes, in fact with this "front end" you can go from DC to 125MHz
Notice the voltage divider between the 10M and 1.5Meg resistors for the series LC configuration.
This allows for a very high input impedance while reading a relatively high voltage at the input
generated across the "LC tap". The Voltage per division on the scope works out to be about .52V
with a maximum of 3.3V this gives just under 6.5 divisions as you can see. Multiply this (3.3V) by
the resistor divider ratio of 10M:1.5M and you get 25.3V or 10M:2.5M and you get 16.5V...
Note: these voltages to the Propeller are only 3.3V through the divider, and the actual voltages
could be higher where clipping is observed. If you don't need to divide the input voltage down,
just omit the 1.5M or the 2.5M resistor.
"I wonder: what will it take to get me to 2.4ghz?"
Hmm... Even with 8-cog's (<--read 8-phases of 125MHz) you might get 1Ghz but I have my doubts.
Perhaps a challenge for you to undertake.
"The brains of a spectrum analyzer on-a a-chip? And switch in various RF front ends for ranges...
Boggle, boggle..."
Not even the tip of the iceberg...
▔▔▔▔▔▔▔▔▔▔▔▔▔▔▔▔▔▔▔▔▔▔▔▔
Beau Schwabe
IC Layout Engineer
Parallax, Inc.
That's really rather impressive. We might see people actually testing their decoupling strategies, rather than hanging 100uF on 2-foot wires, which would be a good thing!
Have I missed a data release on the PLLs, IO assistants or video generators, by the way? I can't see anything on the main propeller page, but...
Steve
Just for my edification, and so I don't sound like a complete idiot ( better to sound like an incomplete idiot? I don't know but):
Time / frequency domain.
If I understand you correctly:
The Bode is like a "snapshot" into a period of Time, where as the OScope is looking at "time", is that correct?
I'm struggling to get a handle on this, but I think it's within my grasp...
▔▔▔▔▔▔▔▔▔▔▔▔▔▔▔▔▔▔▔▔▔▔▔▔
Just tossing my two bits worth into the bit bucket
KK
·
It's also good for filters, such as a low pass filter, to find out what the cutoff frequency would be -- where it changes from a high to low signal strength. Or with a bandpass, to find the range of frequencies it passes.
Hope this helps?
-Martin
▔▔▔▔▔▔▔▔▔▔▔▔▔▔▔▔▔▔▔▔▔▔▔▔
Martin Hebel
Southern Illinois University Carbondale - Electronic Systems Technologies
Personal Links with plenty of BASIC Stamp info
StampPlot - Graphical Data Acquisition and Control
About how long did it take to develop this program ?
Bean.
▔▔▔▔▔▔▔▔▔▔▔▔▔▔▔▔▔▔▔▔▔▔▔▔
"SX-Video·Module"·available from Parallax for only $28.95 http://www.parallax.com/detail.asp?product_id=30012
"SX-Video OSD module"·available from Parallax for only·$49.95 http://www.parallax.com/detail.asp?product_id=30015
Product web site: www.sxvm.com
Available now! Cheap 4-digit LED display with driver IC·www.hc4led.com
"I reject your reality, and substitute my own." Mythbusters
·
yes it does. Thanks.
▔▔▔▔▔▔▔▔▔▔▔▔▔▔▔▔▔▔▔▔▔▔▔▔
Just tossing my two bits worth into the bit bucket
KK
·
Ever tried to price a spectrum analyzer?· How about a dual function spectrum analyzer that doubles as a standard oscilloscope?
How about something that will provide basic information without all of the Bells and whistles?
So why not use a Propeller IC to do the job?
I've had the idea/need for this program for quite some time.· As an example of how you can incorporate someone else’s object
code, things didn't start coming together until Chip provided an example for using the Sigma-delta ADC/DAC converter.· I modified
his original code and schematic so that it works with a high input impedance, and removed the external DAC section.· Another
program that Chip provided uses the specialized PLL counters to synthesize a frequency from DC to 125MHz.· I tied these programs
together with a scope graphic that I created back in January... at the time, the Scope only functioned as a single channel digital
scope as a conceptual design.
After I had all of the pieces in place, it probably took 2 hours or less to put together.· The graphics are trivial; the objects
for basic functions such as POINT, LINE, etc. are already in place, as well as a TV driver.
some Bode Plot information:
http://en.wikipedia.org/wiki/Bode_plot
http://www.facstaff.bucknell.edu/mastascu/eLessonsHTML/Freq/Freq5.html
▔▔▔▔▔▔▔▔▔▔▔▔▔▔▔▔▔▔▔▔▔▔▔▔
Beau Schwabe
IC Layout Engineer
Parallax, Inc.
Post Edited (Beau Schwabe (Parallax)) : 4/4/2006 3:31:15 PM GMT
I'm amazed. Just flat-out blown away by the propeller. $25 is a STEAL for this chip. I can't wait to start playing with it.
Bean.
▔▔▔▔▔▔▔▔▔▔▔▔▔▔▔▔▔▔▔▔▔▔▔▔
"SX-Video·Module"·available from Parallax for only $28.95 http://www.parallax.com/detail.asp?product_id=30012
"SX-Video OSD module"·available from Parallax for only·$49.95 http://www.parallax.com/detail.asp?product_id=30015
Product web site: www.sxvm.com
Available now! Cheap 4-digit LED display with driver IC·www.hc4led.com
"I reject your reality, and substitute my own." Mythbusters
·
Not to take anything away from Beau great example here.....
But to the best of my recollection from University days (truly a long time ago), a Bode Plot required both amplitude and phase versus frequency. Without the phase information it is just a spectrum plot.
Great going Beau!
Cheers,
Peter (pjv)
▔▔▔▔▔▔▔▔▔▔▔▔▔▔▔▔▔▔▔▔▔▔▔▔
Chip Gracey
Parallax, Inc.
pjv,
A Bode plot is "usually a combination of a Bode magnitude plot and Bode phase plot"
en.wikipedia.org/wiki/Bode_plot
Note: The Bode magnitude and Bode phase are usually two seperate graphs, but can
be superimposed.
I didn't specify which (magnitude or phase), but as Chip indicated, with a small
change to the software you can also show phase differences. The way Martin Hebel's
BS2.COUNT routine works as well as the way the BS2.PULSIN routine works provide
a clue as to how the phase can be measured.
▔▔▔▔▔▔▔▔▔▔▔▔▔▔▔▔▔▔▔▔▔▔▔▔
Beau Schwabe
IC Layout Engineer
Parallax, Inc.
Post Edited (Beau Schwabe (Parallax)) : 4/5/2006 3:47:38 AM GMT
Please, I was not attempting to belittle your achievement.... very clever indeed.
It's just the way I remember our Prof pounding that into us. And we didn't have Wikipedia then. Perhaps I should have Googled or Wikied.
Cheers,
Peter (pjv)
▔▔▔▔▔▔▔▔▔▔▔▔▔▔▔▔▔▔▔▔▔▔▔▔
6+6=10 (Long live the duodecimal system)
▔▔▔▔▔▔▔▔▔▔▔▔▔▔▔▔▔▔▔▔▔▔▔▔
Martin Hebel
Southern Illinois University Carbondale - Electronic Systems Technologies
Personal Links with plenty of BASIC Stamp info
StampPlot - Graphical Data Acquisition and Control
"Please, I was not attempting to belittle your achievement.... very clever indeed."
No offense taken, I learned a long time ago that I am not perfect. I take it as
constructive criticism.
Hey, I'm still learning electronics! There is ALWAYS something new to discover,
don't stop at the book in front of you. That's my attitude anyway
Paul Baker,
"Beau, you've been quoting me as the author of the BS2 commands, when it's Martin's. Im flattered, but he deserves the credit."
Opps!! My bad Sorry Martin
Martin Hebel,
"I was staring at my own code trying to figure out how to get phase out of it.... still not sure to tell you the truth"
I think it can be done more so using a derivative of the PULSIN command rather than the COUNT command by manipulating the
phsa or phsb registers and looking at the assigned input and output pins. With the output set as your frequency sweep pin, feeding
the "circuit under test". A test point or probe on the "circuit under test" would be the input. The difference in delay between the
two pins should have the phase relationship you want.
Phase = tdelay * Frequency * 360
Example:
A 60Hz sine wave generated at the output that lagged the input by 4.1667mSec would have a phase of -90 deg
▔▔▔▔▔▔▔▔▔▔▔▔▔▔▔▔▔▔▔▔▔▔▔▔
Beau Schwabe
IC Layout Engineer
Parallax, Inc.
Post Edited (Beau Schwabe (Parallax)) : 4/5/2006 2:42:46 PM GMT
Would these Bode plots be useful to identify EMI from DC motors and such?
I am thinking that many of robotic EMI problems might be more easlily resolved if one could actually identify the frequencies that are most problematic and filter the power supply accordingly.
▔▔▔▔▔▔▔▔▔▔▔▔▔▔▔▔▔▔▔▔▔▔▔▔
"When all think alike, no one is thinking very much.' - Walter Lippmann (1889-1974)
······································································ Warm regards,····· G. Herzog [noparse][[/noparse]·黃鶴 ]·in Taiwan
▔▔▔▔▔▔▔▔▔▔▔▔▔▔▔▔▔▔▔▔▔▔▔▔
Jon Williams
Applications Engineer, Parallax