Plot your way to success... with gnuplot !
 refaQtor
Posts: 202
refaQtor
Posts: 202
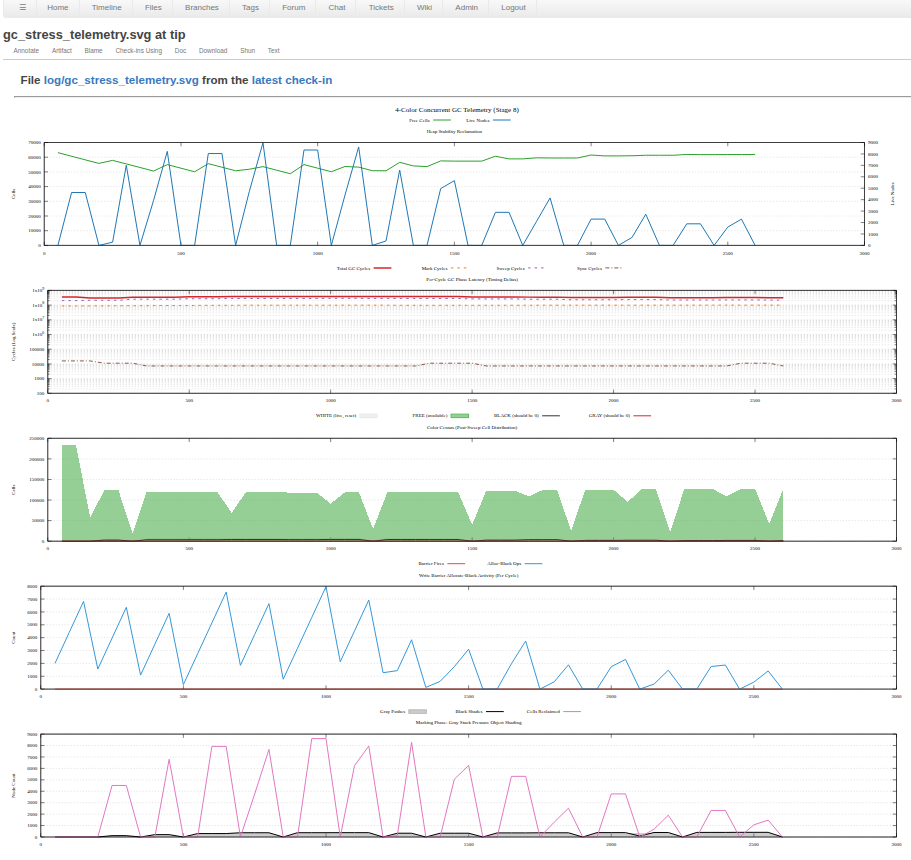
It is always useful to build up a series of [PASS]/[FAIL] sort regression tests to run after every build to confirm that little tweak you just added didn't break something. I even add timing hooks around key code sections to ensure that there isn't an accumulation of design issues that, sometimes slowly, degrade system performance. Dynamic resource allocation systems are a different story. It take a batch of telemetry collected and plotted over the execution time, where trends and patterns reveal the success or failure. and I use gnuplot to produce a version-control friendly .svg file from the .csv metric data that my tests write out to the console (and capture in a file)
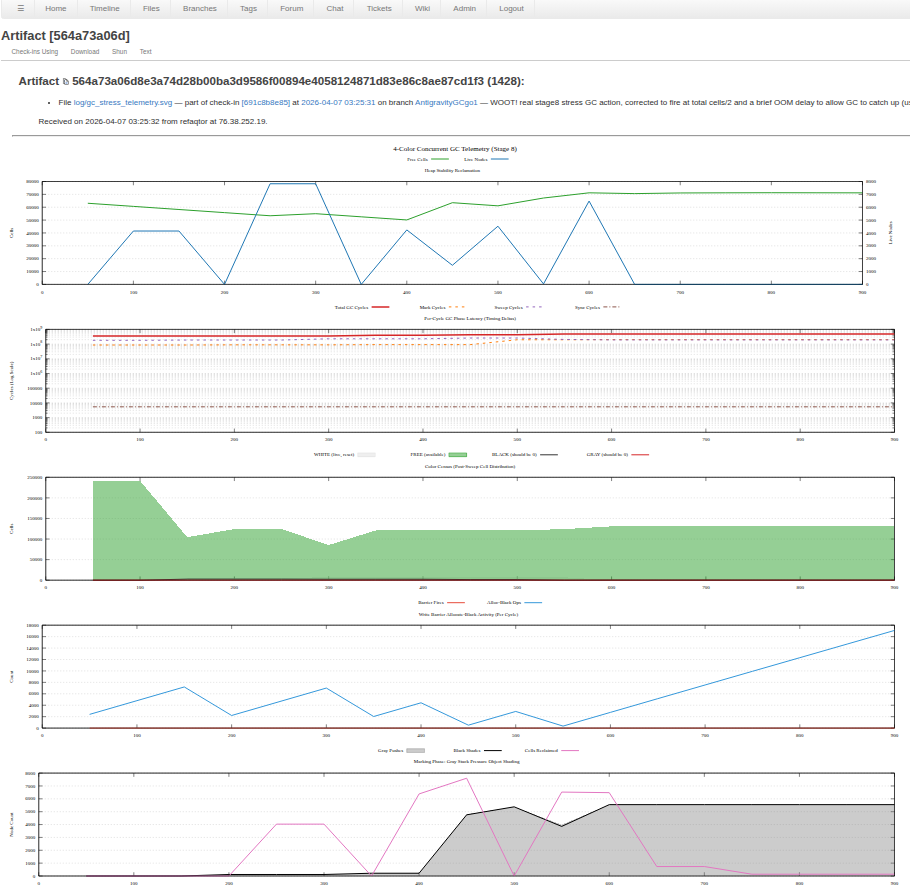
in my Fossil version control repository I am watching the changing plots to see, in this case, when I go from a garbage garbage collector to a working garbage collector on my Lisp system using P2 XBYTE bytecode processor. 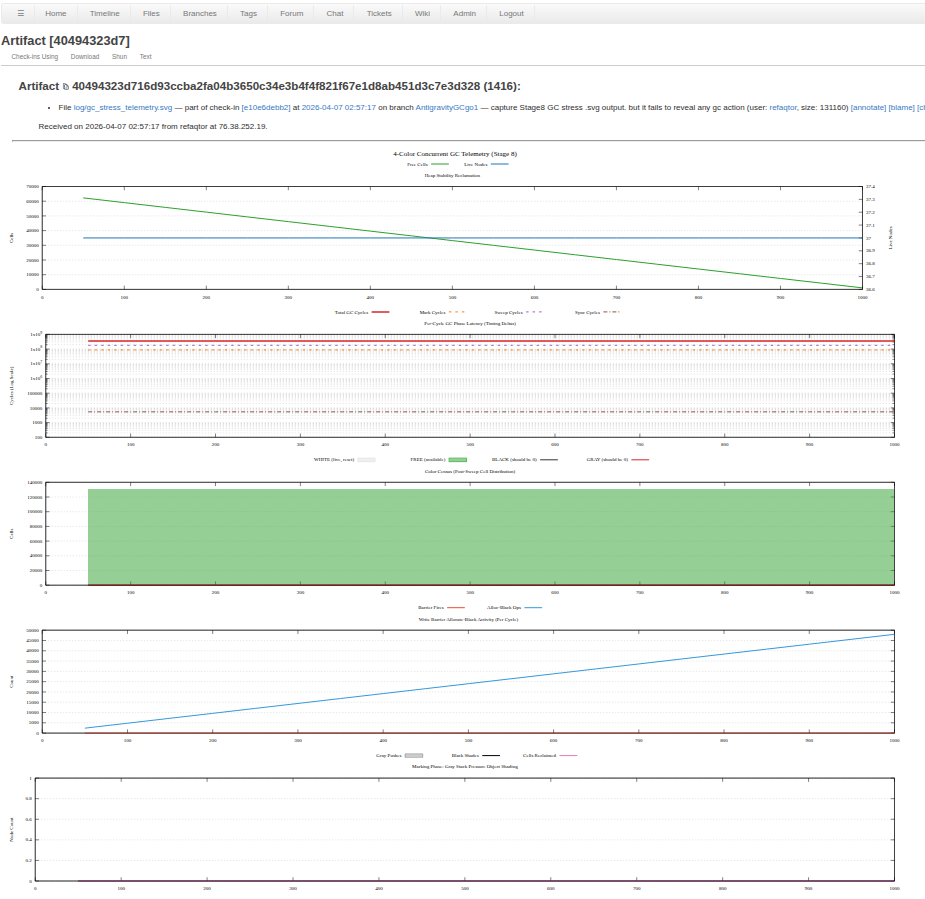
Comments
and a working better garbage collector, using multiple gc Spin2 Tasks on the parallel cog.