Help with Debug function not working
Hello,
I'm fairly new to the Prop 2 and am trying to use the debugger function for the first time. I've sifted through most of the documentation I could find and haven't found any troubleshooting information.
I'm running Propeller Tool 2.9.3
In the Examples I choose "DEBUG_demo.spin2.
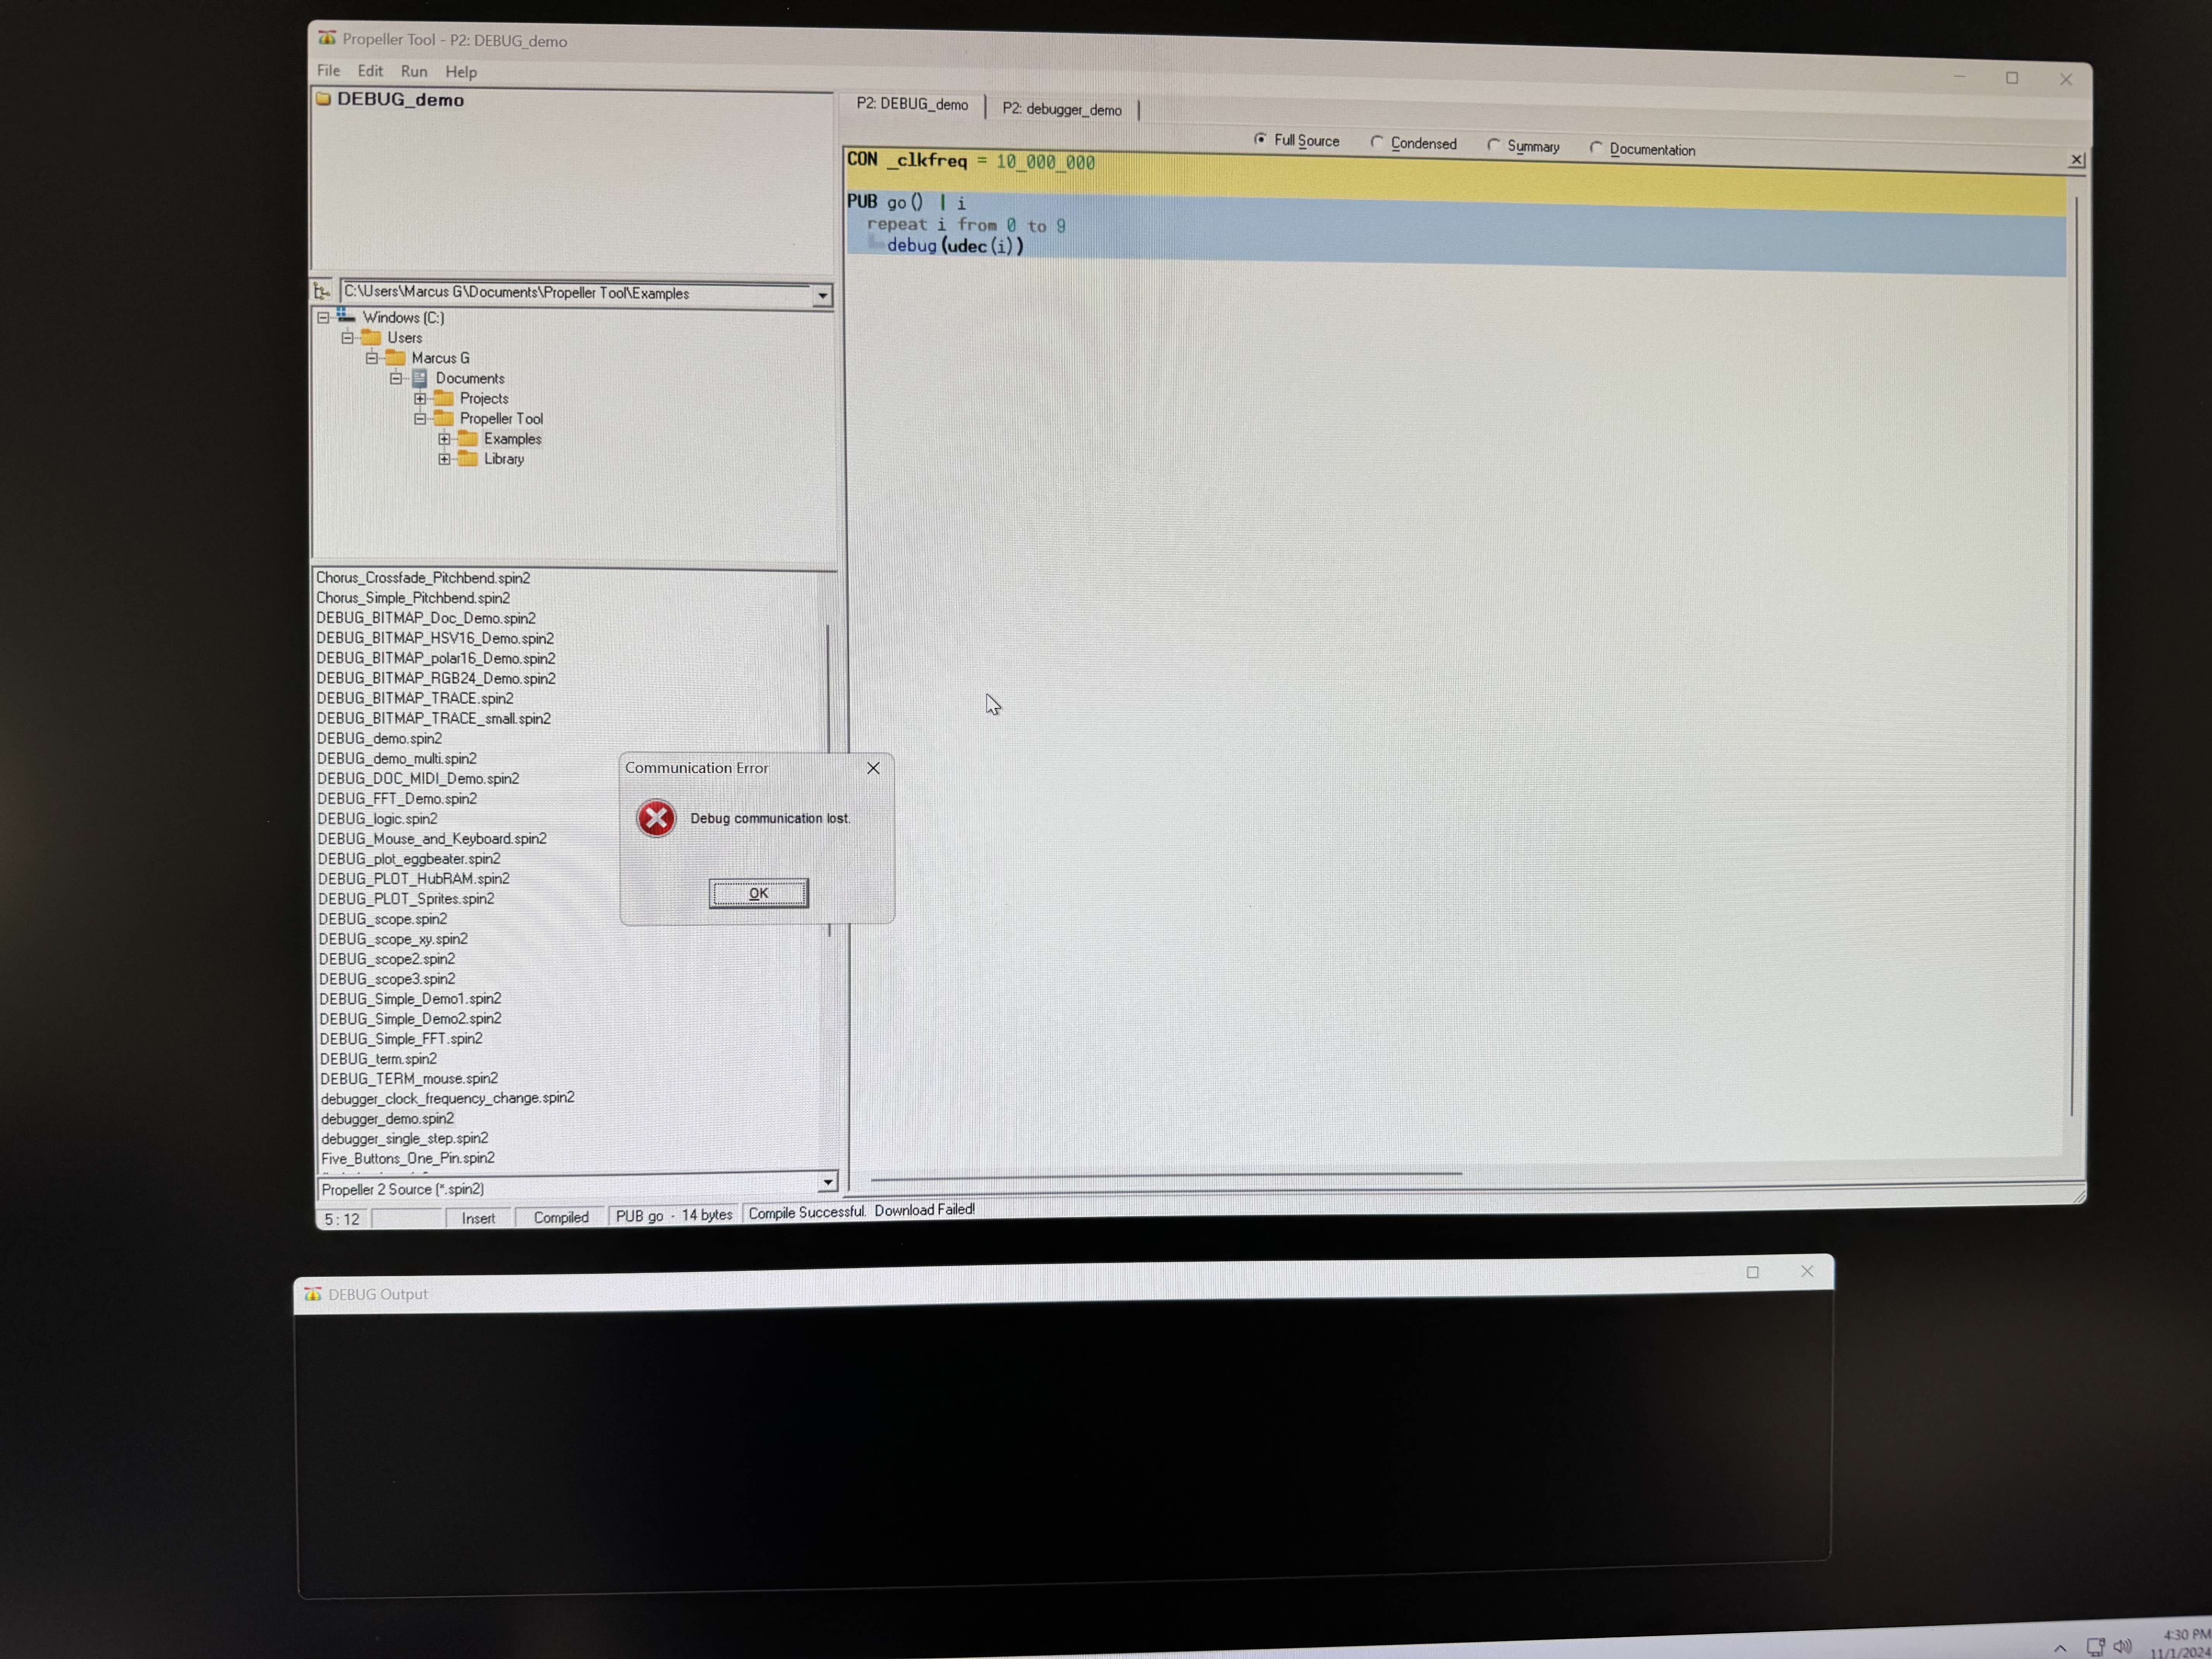
When I Load to Ram (with the debug enabled) the debug windows pop up, but then immediately the square shaped window disappears, and an error dialog states "Debug communication lost." with an OK button. The longer black rectangular window remains.
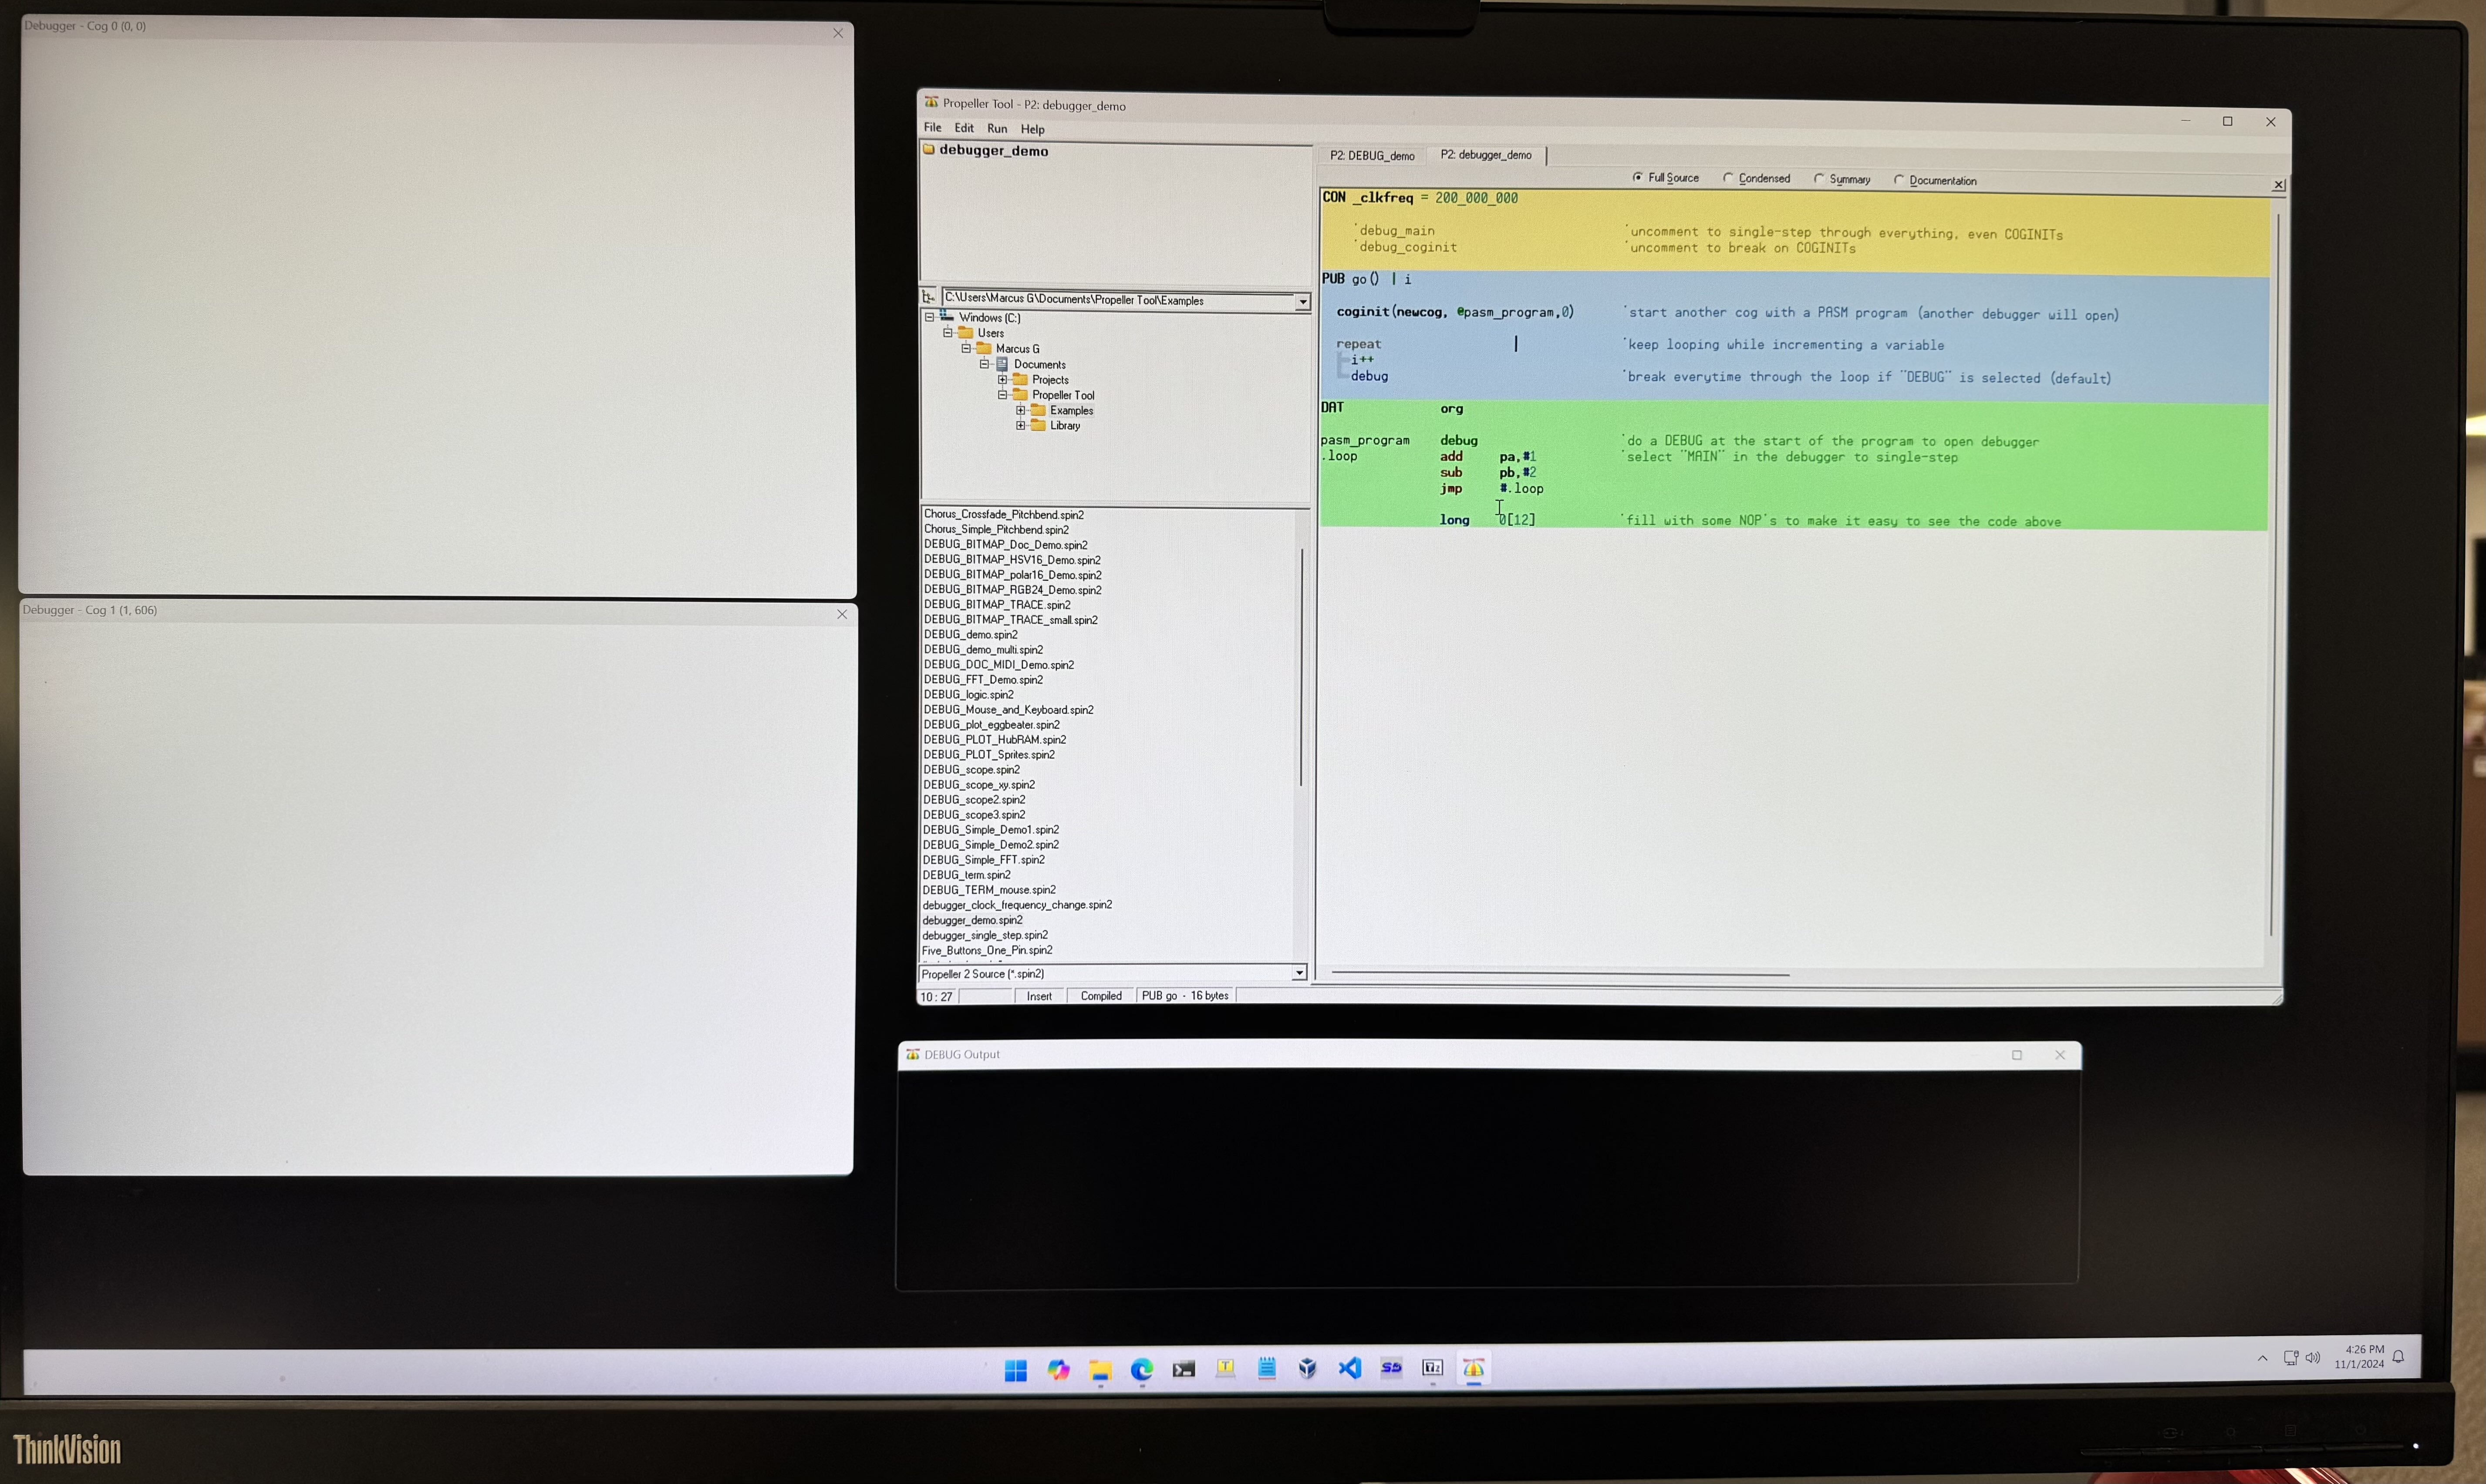
Interestingly, when I run "debugger_demo.spin2" (2) white square windows appear, along with the black rectangular one, and no error dialog appears. Although that's it, nothing else happens. (see picture attached)
Any ideas what could be happening?
Thanks,
Marcus


Comments
Is this a self-made board or a Parallax one?
Debug_Demo should work...
Maybe I've had trouble when using some USB hubs...
Can you try directly connecting to PC USB port?
Think by default the debug baud is very high, like 2 MBaud.
There are some override commands to slow it down though...
Hey Rayman,
I’m using the OG propeller 2 edge board (rev A) on the P2 edge development board with the prop plug. I did try the 1_000_000 baud setting, but that didn’t affect anything. I do have the prop plug USB connected directly to one of the PC’s front USB ports
After writing the first post, I installed Spin Tools IDE and I did see the debug messages in the debug window. So it may be an issue I specifically have with the propeller tool.
Thanks,
Marcus
@Mag748 That's a real puzzle there. Is there any process running that might be polling serial ports?
I think PropTool Debug does not want to share access with anything else...
@rayman,
I've ensured there's only one serial port (the prop plug) connected, and freshly restarted the computer, so I don't think there should be any serial port confusion. I also switched the USB cable to one of the ports on the back of the computer to ensure there wasn't any hub issue.
I've gotten it to work by setting the DOWNLOAD_BAUD = 1_500_000
The console message are now being displayed. I also notice a few of the other demos give the option to uncomment to reduce the debug_baud rate. Makes sense, although for my system, even that's not enough, I think the download might not be working at the full baud rate.
Unfortunately, the debugger windows are still just all white.
I've heard of people seeing improvement after playing around with advanced serial port settings...
Might be worth a shot...