

PASM level debugger
 ManAtWork
Posts: 2,369
ManAtWork
Posts: 2,369
I anybody using Chip's PASM level debugger? I tried it for the first time, today, and I can't get it to work. Is the chapter "PASM-Level debugger" in the Spin2 manual the only available documentation?
I run a simple program with cog0 executing spin. I start a second cog with coginit executing assembler code. I've placed a single debug statement without braces somewhere in the code. All I get is an empty debugger window.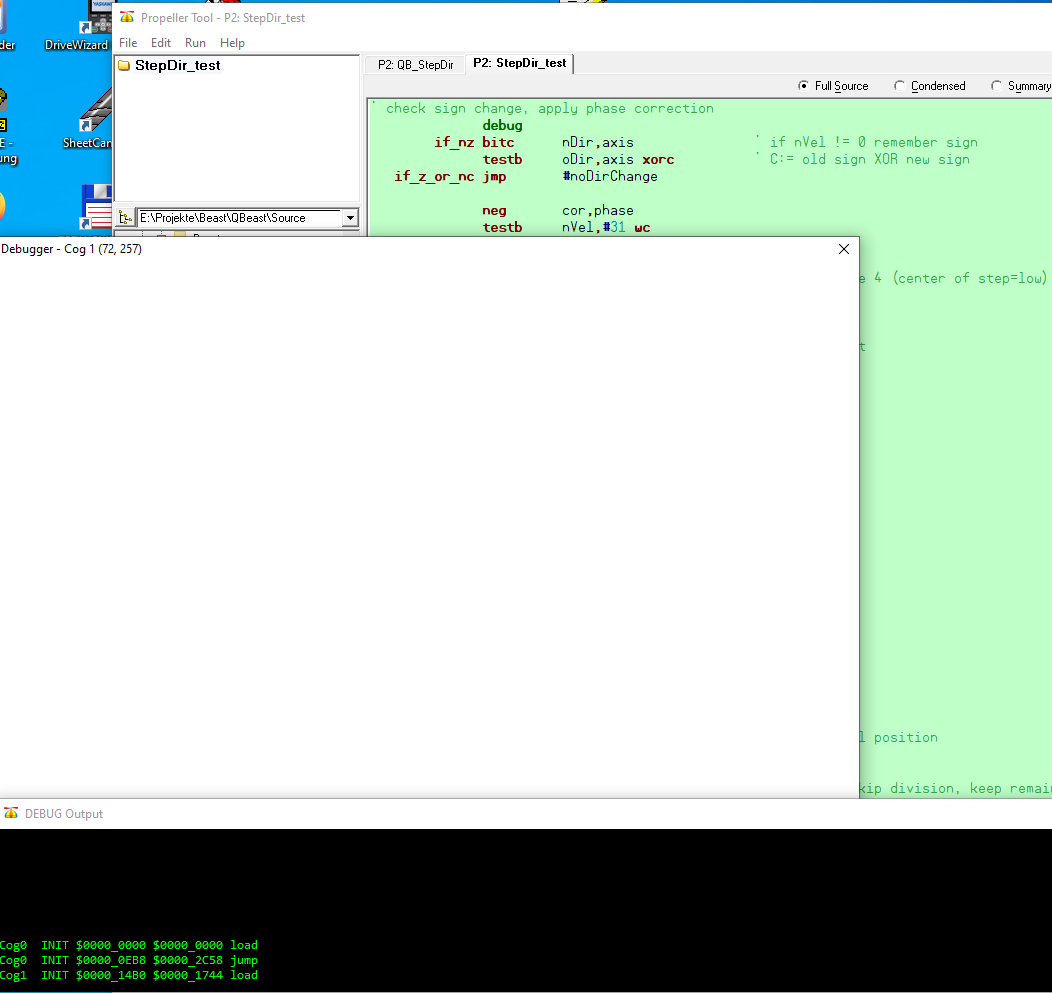
The RX and TX LEDs on my ProgPlug are flashing all the time so there is some communication but nothing gets displayed. As there is something visible in DEBUG Output window I assume that the COM port is working and the baud rate is set correctly. And yes, I have set the latency in the Windows device manager from 16 to 1 as suggested in the manual.
Anything else I have to do? FYI, I use a KISS board with 25MHz crystal. Do I have to set the long repository of P63 manually if the clock settings are non-standard? I set the clock frequency only once with
CON
  _xtlfreq = 25_000_000                     ' KISS board
  _clkfreq = 200_000_000                    ' clock frequency
which has worked quite well until now.
Comments
Seems to be a proptool problem. I am not sure if I ever tried it there before, at the moment I see the same. Try pnut. There is also a demo-file 'debugger_single_step.spin2'.
Looks like you need special command after clkfreq:
CON _clkfreq = 200_000_000
debug_main 'run debugger(s) for all main code
That looks like the window contents just aren't rendering.
I tried the demo 'debugger_single_step.spin2' in Propeller Tool (V2.9.3) but with same result, empty white window. In PNut v39 it works, though.
However, there seems no easy way to get it to work with my current VSC setup. I use Flexspin as compiler and PNut for debugging which works for simple debug() statements. But flexspin doesn't support the single step debugger, I think. It complains with
error: syntax error, unexpected end of line, expecting '('afterdebug.I hoped this would work because without the listing files of Flexspin it's hard to figure out which registers are at which locations as no labels are displayed in the debug window. I doubt that this debugger is of any use to anybody with a lower brain capacity than Chip. At least, I fear I'm to stupid to handle it. Or I'm too spoiled by the symbolic single step debuggers on other platforms.
Flexpin supports only limited set of debugging commands.
That's not a bad idea - Compile using Flexspin and runtime debug using Pnut. Just need to flesh out the debug commands that can be compiled.
I've already posted how this can be done here but nobody seemed to care or at least nobody reacted.
So I've played around a little bit with the PASM debugger and I actually found a bug where my code took the wrong branch. But it's very hard to figure out what's actually going on with the data registers. @cgracey Chip, how is this supposed to work? I can put a marker (say, marker long $AAAA_BBBB) after my code so I can see where the data starts. Then I have to count manually, which register has which address? That's trivial for a small example like 'debugger_single_step.spin2' but my code has tens or even hundreds of variables and each time I change the code I have to update the address list manually. Really?
Don't get me wrong. Some ideas of the debugger are really brilliant like the "hot spot" display of the memory map. I do understand that a fully featured symbolical debugger would be a lot more work and may be even impossible or confusing for extreme cases like self-modifying code etc. But there needs to be a way of matching the memory/register display to the corresponding labels in the source code. I've watched this and this video and Ada (Wuerfel_21) also complained about the debugger not displaying symbol addresses.
Wait a moment. I remember, placing the cursor inside a spin function in Propeller tool displays it's byte code size in the status line....

 Sometimes, a bit more documentation or a quick byte "how to use the debugger" would be really helpful.
Heureka! If you place the curser on a label inside a DAT section the corresponding cog ram address is displayed in the status line.
That still means I have to have three windows open while developping code. VSC where I do the actual coding, Propeller tool to display the adresses (where the debugger unfortunatelly doesn't work) and PNut for debugging. Could be improved a bit in the future but at least works for now.
I haven't used VSC at all, and generally don't use any IDEs.
Grrr, celebrated too early. The address displayed by Propeller tool is the OBJ based offset, not the cog ram address (DAT ORG based). So I think the PASM debugger is only useful for very special cases like debugging branching, skip masks, self modifying code, memory corruption and so on where normal debug() and printf debugging doesn't work very well. For everything else that requires tracking of register and variable values and that doesn't rely on real time standard debug()/printf is better. Realtime debugging is only possible with graphical debug windows (scope display), post mortem logfile analysis or signal taps with DAC pins.
It should display both the object offset and the cog address. I think there was a bug where it wouldn't do it properly in some cases, but it certainly should.
Adding support for the parenless DEBUG to flexspin (and updating the debug blob) wouldn't be a problem, but I think the holdup there was that PNut can't start a debug connection for a pre-established binary.
It displays two values:
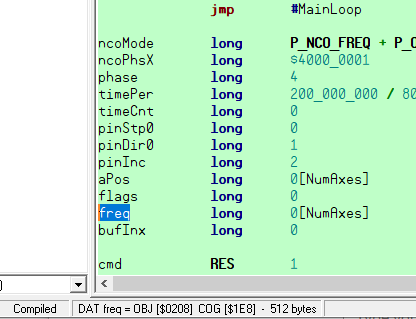
The COG value is the OBJ value minus $20. But I have much more than 32 bytes code in the cog memory. The real cog address of freq should be something around $80 to $90. So I have to divide by 4?
The debug connection for the terminal window and graphical displays works perfectly. Is the PASM debugger any different?
I'm pretty sure it's supposed to be in longs for the cog address. Are you sure you aren't doing weird things with your ORGs? Do you have any unrelated DAT content before your code? Don't have access to Propeller Tool right now...
Yes, I'm sure. I just checked it out.
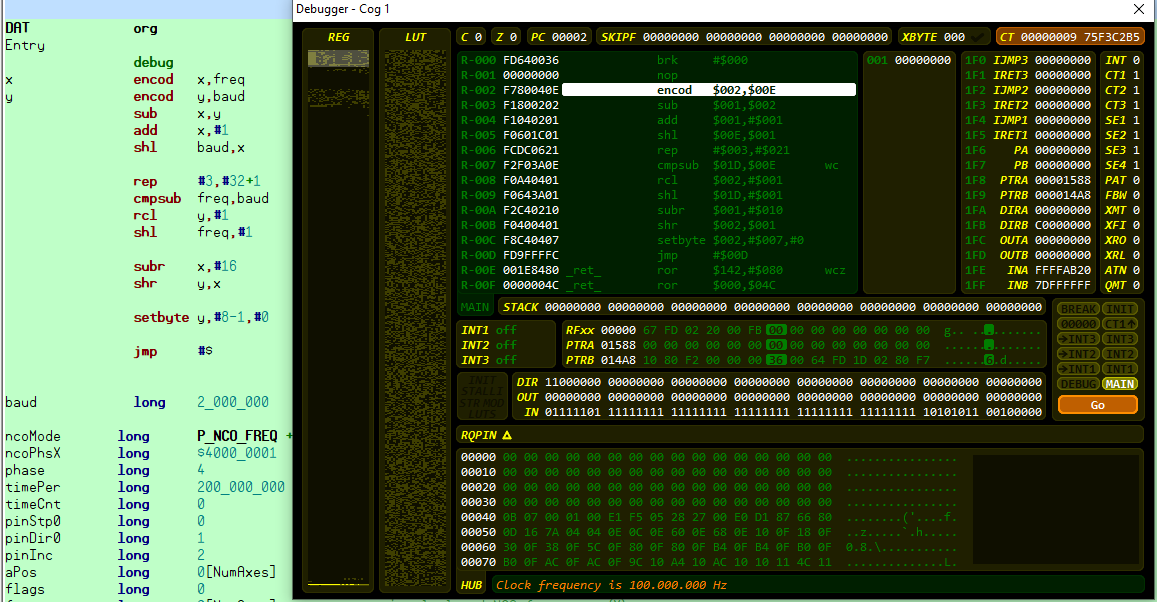
Propeller tool displays COG [$004] for x, COG [$008] for y and COG [$038] for baud. The debugger displays $001 for x, $002 for Y and $00E for baud. So Propeller tool displays byte addresses and not register (longword) addresses.
Ah yes, that was the bug. I'm pretty sure that was reported and fixed at some point though. Using latest version?
If PNut can indeed open a debug connection to a flexspin-compiled program, idk why the interactive debugger hasn't been integrated yet. I guess I am responsible for flexspin's debugging component, so oh well, will have a look at it later. Main issue is getting the grammar (that is already quite tortured) to work and merging in the new blob code (flexspin's is based off the PNut version where floating point support was added, ut then we did some changes on top which need to be maintained)
Yes, PTool version 2.9.3 and PNut v39 should be the latest, I think.
It's not urgent and I can live with it how it's now. But having the possibilty to use Flexspin together with the debugger would be great as the current solution is not very user-friendly. Flexspin generates listing files so adresses could be looked up quickly. The ultimate goal should be some mechanism so that the debugger could process some form of symbol files. But I think that's not going to happen, soon.
To counterbalance my endless complaints.... I just saw that the P2 assembly language manual looks completed. Nobody told me. But thats really cool.") And as I said, graphical debugging already works together with VSC and Flexspin.
And as I said, graphical debugging already works together with VSC and Flexspin.
I can only see November 2022 version there, that is not completed....
Compiler changes for making debug without paren generate BRK #0 were suprisingly easy: https://github.com/Wuerfel21/spin2cpp/commit/567828b2e7304f6e49c45cf80ff1cff4a7c84509
Well, need to figure out the blob now.
@ManAtWork here's a mostly untested build of flexspin with new debugger (need to log into github to not get a 404): https://github.com/totalspectrum/spin2cpp/suites/15573759752/artifacts/888725274
Try poking at that if you want.
It works!
Thank you very much!
What's missing? The last time I looked there were some instructions missing. Now, AFAICS, all instructions have at least some lines of explanations. Of course, it can always be improved, examples added etc...
There is a list of instructions starting at page 15 of the manual. Instructions that are described are active blue links. All that is black has no detail description yet.