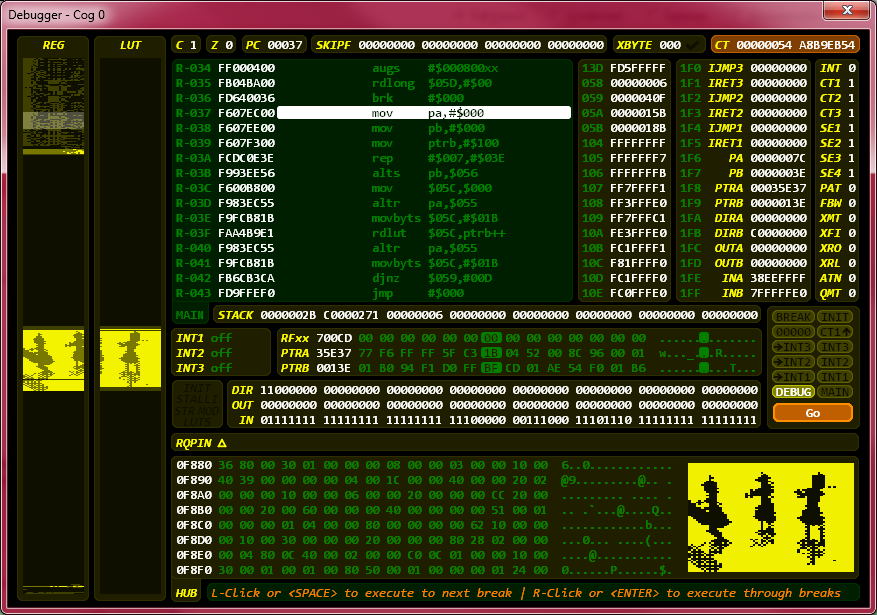
Bad Apple on P2 debugger
 Wuerfel_21
Posts: 5,845
Just normal things to coldpost at 3AM.
Load bad_debug.spin2 into PropTool. Compile with debug enabled. Right-click the "Go" button. Be amazed. Or not. I'm not your mom.
The persistence of the memory window is a bit too high for this and the REG/LUT window has a seam in the middle. Can't have everything in this world.

zip

295K


Comments
Ada, I am amazed.
Very cool use of the debugger as an anime animation presentation engine.
Maybe we can get Chip to give us a way to vary the persistence of the HUB Heat map memory window.
It is interesting that the animation still seems to run at a reasonable speed even when you run with a clock of only 10_000_000 instead of 320_000_000.
Keep up the good work, you always seem create/show interesting uses in the P2 environment.
-- Francis
I think there's an artificial cap on the PC side for how often the debugger will update. The actual code also isn't doing much (very basic decompression and shuffling around of 64x62 pixels), despite being rather unoptimized.
Also, note the occasional glitch in the memory heat map where it will just not notice any changes in a 4K block (i.e a line of 32 pixels doesn't update) because the checksumming it does is kinda Smile. Also, notice that the pixels aren't evenly spaced/sized.
Oh, and before I forget, the silly script that builds
bitstream.datfrom a raw 1bpp file (FFMPEG "monob" rawvideo export)# frozen_string_literal: true prevframe = 0 WIDTH = 64 HEIGHT = 62 BITS = WIDTH*HEIGHT BYTES = BITS/8 runs = [] running = 0 framect = 0 def reverse8(b) b = (b & 0xF0) >> 4 | (b & 0x0F) << 4 b = (b & 0xCC) >> 2 | (b & 0x33) << 2 b = (b & 0xAA) >> 1 | (b & 0x55) << 1 return b end File.open("badapple.raw","rb") do |inf| until inf.eof? #|| framect > 100 curframe = 0 BYTES.times{|i| curframe |= (inf.getbyte) << (i*8)} delta = prevframe ^ curframe BITS.times do |i| #if runs.count[0] == delta[i] if delta[i] == 0 running += 1 else runs << running running = 0 end end prevframe = curframe framect += 1 end end puts "#{runs.count} runs over #{framect} frames!" puts "Phase change probability is #{runs.count.to_f/(framect*BITS)}" RICE_BITS = 4 RICE_MASK = (1<<RICE_BITS)-1 File.open("bitstream.dat","wb") do |out| bitbuffer = 0 bitfill = 0 bitcount = 0 bytecount = 0 runs.each do |rl| quot = rl>>RICE_BITS remain = rl & RICE_MASK code = ((1<<quot)-1) + ((reverse8(remain)>>(8-RICE_BITS)) << (quot+1)) bitbuffer |= code<<bitfill size = quot + 1 + RICE_BITS bitcount += size bitfill += size while bitfill >=8 if bytecount % 128 == 0 out.putc(reverse8((bytecount/113)&255)) bytecount += 1 end out.putc(bitbuffer&255) bytecount += 1 bitbuffer >>= 8 bitfill -= 8 end end puts "Total bit count: #{bitcount}. Kbyte: #{bytecount/1024.0}" end File.write("runs.txt",runs.inspect)I was really wanting to see this, but can't get it to work with PropTool 9.2.9

I get that one occasionally. I just try again and then it works. I guess you tried that *shrug*. The mysteries of the COM port.
I got it to run once. Very cool!
IIRC @"Jeff Martin" wanted to hear about cases of the debugger being unreliable like that, so let's just tag him.
Thanks @Wuerfel_21 and @ke4pjw for reporting (and @Wuerfel_21 for the cool animation).
That error is one I was concerned about happening (I've seen it a few times also) and was unsure what to do about it if it happens... also why it happens. The end result is that the Propeller Tool's main thread loses contact with the debug thread (i.e. its handle to the debug thread is refused by the OS as a valid handle, or it claims it doesn't allow the "closing" operation on the thread). I too have seen that just trying again seems to work just fine, so I may have to experiment and have it quietly try again or just ignore it and move on. The latter seems like potential to lead to later memory or resource errors, so I didn't want to settle on that idea without collecting more reports from users like this.
Jeff, I have "Serial Port Monitor" by ELTIMA Software. I will see if I can gather some diagnostic info on what's happening. That software that indispensable a few years ago when I was developing a Propeller 1 based "DMX dongle".
Are you trying to force-kill one thread from another using the OS API? Seems like an invitation for resource leaks and strange bugs. I think(tm) it's a lot more usual/common to have the other thread return normally by detecting when some "stop flag" in memory has been set.
I couldn't put the log into a single file. See attached.
It appears to be closing after a read.