Possibly the hardest thing here might be modifying p2link to separate its code and data - not sure yet, haven't dug into that one.
I looked into this today, and it turns out it would need modifications to @"Dave Hein" 's great p2asm tool not just p2link for this. Probably quite a substantial effort if you don't know the code very well and I'm not willing to go there yet for testing this out as I won't easily know if the tool changes are causing bugs or my own external memory execution scheme itself.
So what I am hoping for now, just for my initial testing, is to just compile some smaller test programs as LMM and map 0x400 onwards to external memory for all code branches and jumps (instead of addresses above 1MB), while retaining the data in it's existing places in HUB RAM. So I will just copy the first 512kB of HUB RAM into external memory at the same addresses. That way I can at least try out my code to see if it gets read from external code and executed from i-cache while it can continue to read its data from the original HUB RAM addresses. The HUB RAM will obviously still have a copy of the executable image, it will just not be executed (if this scheme is working). I could probably even attempt to use my recompiled MicroPython image if it works out, and see just how much slower it runs.
Getting the overall image built, booting, spawning the memory driver COG and copying the image over into external RAM before starting it will be a requirement now, along with other steps I identified previously. Still quite a bit that has to go right to test this concept...
Also fixed a couple of bugs in my prior posted code which would not have worked correctly.
So I was able to modify s2pasm in the p2gcc toolchain to get my external memory scheme ready to test. It's still not quite complete integration as yet or ready to run but I can fully compile and link the entire MicroPython C codebase natively now using this method, so I know the process will let us translate nicely in LMM mode.
Here's an example of some MicroPython file translation from P1 code to P2 code. The "brs" is a pseudo branch instruction in LMM mode, and "lcall" is for calls. To keep p2asm happy I found I needed to use callpa ##,S instead of callpa ##, # but that's okay, it only burns a few extra COG longs as storage for the jump pointers which we can spare, and doesn't slow it down.
It would be nice to detect branches within the block, and use JMPs instead for those short jumps but that would require knowledge of the address, and the translation tool doesn't know this. However we might be able modify it in the assembler or linker as another optimization later once the address and distance is resolved. We'd hunt for cases of callpa, ##addr, farjmp where the ## address value is within the same 256 byte block as this instruction itself and swap to a jmp ## using relative offsets (as well as NOPping out the prior AUGD).
Have been bashing my way through this over the last 5 days trying to get something to execute using the new callpa #, farjmp method for jumps and calls/etc. I have had to make some mods to the p2gcc toolchain to get this point.
Specifically it turned out that P2ASM didn't like this way of doing things as it doesn't recognize the reference to main as a global function name, but more as a global data variable for CALLPA, even with an extern main() function prototype declared earlier in the file.
callpa ##main, farjmp
What would happen is that it would create a symbol table variable called main and refer to it at address 0x800 (I've also moved the HUB start address from 0x400 to 0x800 now to make room in the VM COG for more external access instructions). The linker would try to update this to use the address of main when it finally determined it later, but would fail because the original symbol created for main was not of the type OTYPE_REF_AUGD. The failure to update would cause a jump to default address of 0x800 not the real address of the "main" entry point.
I made a hack in P2ASM just for the callpa #,# and callpb #,# instructions so it would call CheckVref when parsing the D field and it seemed to help...still testing it but my code at least now enters the main function (the actual external memory portion is bypassed for now, so I can prove the compilation itself works).
        case TYPE_OP2DX:
        {
            CheckVref(i, tokens, num, 0);   // <---------- NEW LINE ADDED
            value = EncodeAddressField(&i, tokens, num, 1, opcode, 1);
            opcode |= (value & 0x1ff) << 9;
            if (value & 0x200) opcode |= Z_BIT;
            if (CheckExpected(",", ++i, tokens, num)) break;
            ProcessRsrc(&i, tokens, num, &opcode);
            break;
        }
This stuff is tricky. You have to dig into the inner workings of the p2asm and p2link stages and symbol table data to figure out what's up.
Finally got my callpa #, farjmp methods working with p2gcc after much pain figuring out why things wouldn't work and resorting to LED debug because even my UART code was broken as well.
I found that callpa ##$+8, farjmp syntax would silently fail, as it would not have a proper label to compute the relative branch offset correctly created in the linker. This sort of code got used a lot to translate these SPIN1 LMM constructs to skip the next branch:
I know this is inefficent because a branch is taken in both cases of the if statement. Ideally we could just have this code generated from the GCC output, but we don't currently have that luxury as it was created with the P1 LMM VM in mind. Maybe I can muck about with s2pasm to get there eventually...
cmps r0, #0 wz,wc
IF_NE callpa ##.L251
So to quickly fix this issue I just created a farjmprel handler as well which would apply the PA register value as an offset to the current PC to get the branch address. This worked because the linker needed no relocation with it.
So with this change my test code seems to work now and I can even run MicroPython with it (just executing indirect branches to HUB RAM - not yet external RAM):
# loadp2 -t build/python.bin
( Entering terminal mode. Press Ctrl-] or Ctrl-Z to exit. )
#########################
# Native P2 MicroPython #
#########################
MicroPython v1.11-105-gef00048fe-dirty on 2022-02-24; P2 BOARD with Propeller2 P2X8C4M64P
Type "help()" for more information.
help()
Welcome to MicroPython!
For online docs please visit http://docs.micropython.org/
Control commands:
CTRL-A -- on a blank line, enter raw REPL mode
CTRL-B -- on a blank line, enter normal REPL mode
CTRL-C -- interrupt a running program
CTRL-D -- on a blank line, exit or do a soft reset
CTRL-E -- on a blank line, enter paste mode
For further help on a specific object, type help(obj)
I should finally be able to test out my caching code experiment with an emulated external RAM transfer delay and just copy the code from the original HUB RAM address it is situated in to each cache line while still doing the actual caching of code. This simplifies the test setup because I don't have the luxury of having SPIN2 to set everything up in the p2gcc code environment and I won't have to mess about initializing external PSRAM or HyperRAM in my code at this point.
For reference I did our normal MicroPython benchmark with the indirect branches installed and got these results that follow. It would be good to compare this with the same when running from cache:
run()
Testing 1 additions per loop over 10s
Count: 364125
Count: 364148
Count: 364147
Testing 2 additions per loop over 10s
Count: 262917
Count: 262927
Count: 262928
Testing 3 additions per loop over 10s
Count: 208179
Count: 208187
Count: 208187
Testing 10! calculations per loop over 10s
Count: 16423
Count: 16423
Count: 16423
Testing sqrt calculations per loop over 10s
Count: 180508
Count: 180509
Count: 180509
LOL. Sometimes progress can be non-linear once there's a breakthrough...
Also I just looked at the s2pasm changes to optimize those branches. I think something can be done there in the end to drop half these branches, that would help speed things up (and reduce code space by a long on each conditional branch like shown above). If a proper compiler was targeting this external memory mode tracked the block offset at each branch instruction generated, a simple local HUB-exec branch could be used whenever the branch target fell in the same block. That would be another speed up and can avoid checking the target block for every single branch, only needing to for those that jump out of the current block.
Wow, just made the change to the dual jumps on all IF conditions in s2pasm so only one of the conditions actually branches now and it sped things up nicely...check these results vs above. This would potentially be a good thing to include into the normal build at some point:
Note: this is running at 252MHz, so shouldn't be compared directly to the original tests we did way back for MicroPython at 160MHz.
run()
Testing 1 additions per loop over 10s
Count: 469434
Count: 469432
Count: 469431
Testing 2 additions per loop over 10s
Count: 352321
Count: 352336
Count: 352336
Testing 3 additions per loop over 10s
Count: 282489
Count: 282501
Count: 282500
Testing 10! calculations per loop over 10s
Count: 19542
Count: 19542
Count: 19541
Testing sqrt calculations per loop over 10s
Count: 213769
Count: 213695
Count: 213696
With my indirect branch code now working, I was able to actually simulate the cache performance from external memory by introducing a delay representative of the external memory access delay and varying the hit ratio. I tried to use the same average clock delays that would emulate the current code overhead I have in my own cache control logic. The MISSDELAY is perhaps a bit ambitious if I use my current external memory driver COG but might be achievable if accessing the memory directly from the client COG (will have to check the expected latency for 256 byte transfers with my own COG and update with real world numbers). It's actually probably quite reasonable for 128 byte block transfers though with the same hit ratios.
Here's what I did...
farjmp is the indirect jump target for my callpa stuff doing normal branches. I also included the simulator call in the function calls and relative jumps too (not shown), so all branch types get covered. I didn't simulate the intra-block jump optimization which is actually a slightly faster case in my own code because it can avoid a HUB memory access, but that would only increase the performance slightly.
CON
HITRATE = 6
HITDELAY = 20
MISSDELAY = 320
DAT
...
farjmp long farbranch
farbranch
call #simulator
pop ina
jmp pa
simulator
incmod cachehits, #10 ' count to ten to give 10% steps for testing
cmp cachehits, #HITRATE wc
if_c waitx ##HITDELAY
if_nc waitx ##MISSDELAY
ret wcz
cachehits long 0
With this simple simulation code included I collected some MicroPython benchmark results for different cache hit ratios. This is reasonably accurate in terms of additional overhead time for branches however the distribution of where the overhead happens is not the same as what would happen in the real world. Despite that it is still useful and represents the proper hit/miss ratio timing added to the code. Also this does not take into account the extra overhead of bringing in a new row every 256 bytes as you execute past the boundary, however that is not expected to be too significant compared to the actual cache hit/miss stuff, and it is quite likely you would have already branched out before you reach the end of the cache row anyway.
Here are the results I obtained for different hit ratios : 50%
run()
Testing 1 additions per loop over 10s
Count: 94335
Count: 94329
Count: 94330
Testing 2 additions per loop over 10s
Count: 68720
Count: 68718
Count: 68718
Testing 3 additions per loop over 10s
Count: 54131
Count: 54129
Count: 54129
Testing 10! calculations per loop over 10s
Count: 4336
Count: 4338
Count: 4336
Testing sqrt calculations per loop over 10s
Count: 41164
Count: 41099
Count: 41103
60%
run()
Testing 1 additions per loop over 10s
Count: 105630
Count: 105628
Count: 105628
Testing 2 additions per loop over 10s
Count: 77023
Count: 77022
Count: 77021
Testing 3 additions per loop over 10s
Count: 60702
Count: 60699
Count: 60700
Testing 10! calculations per loop over 10s
Count: 4840
Count: 4842
Count: 4840
Testing sqrt calculations per loop over 10s
Count: 46129
Count: 46130
Count: 46130
70%
run()
Testing 1 additions per loop over 10s
Count: 120012
Count: 120003
Count: 120003
Testing 2 additions per loop over 10s
Count: 87609
Count: 87607
Count: 87607
Testing 3 additions per loop over 10s
Count: 69087
Count: 69086
Count: 69085
Testing 10! calculations per loop over 10s
Count: 5477
Count: 5479
Count: 5478
Testing sqrt calculations per loop over 10s
Count: 52573
Count: 52510
Count: 52511
80%
run()
Testing 1 additions per loop over 10s
Count: 138914
Count: 138907
Count: 138907
Testing 2 additions per loop over 10s
Count: 101568
Count: 101564
Count: 101564
Testing 3 additions per loop over 10s
Count: 80162
Count: 80158
Count: 80159
Testing 10! calculations per loop over 10s
Count: 6308
Count: 6309
Count: 6309
Testing sqrt calculations per loop over 10s
Count: 61039
Count: 60978
Count: 60977
90%
run()
Testing 1 additions per loop over 10s
Count: 164875
Count: 164880
Count: 164880
Testing 2 additions per loop over 10s
Count: 120818
Count: 120813
Count: 120812
Testing 3 additions per loop over 10s
Count: 95464
Count: 95459
Count: 95460
Testing 10! calculations per loop over 10s
Count: 7435
Count: 7437
Count: 7435
Testing sqrt calculations per loop over 10s
Count: 72680
Count: 72616
Count: 72615
100%
run()
Testing 1 additions per loop over 10s
Count: 202795
Count: 202798
Count: 202798
Testing 2 additions per loop over 10s
Count: 149056
Count: 149062
Count: 149063
Testing 3 additions per loop over 10s
Count: 117985
Count: 117979
Count: 117979
Testing 10! calculations per loop over 10s
Count: 9052
Count: 9051
Count: 9052
Testing sqrt calculations per loop over 10s
Count: 89734
Count: 89730
Count: 89665
For fun I also simulated 0% cache hit rate (all external memory accesses for every branch). Surprisingly it still functioned reasonably well (less than 10x slower than native, which is still quite usable): 0%
run()
Testing 1 additions per loop over 10s
Count: 61461
Count: 61462
Count: 61462
Testing 2 additions per loop over 10s
Count: 44655
Count: 44654
Count: 44655
Testing 3 additions per loop over 10s
Count: 35124
Count: 35124
Count: 35124
Testing 10! calculations per loop over 10s
Count: 2851
Count: 2852
Count: 2852
Testing sqrt calculations per loop over 10s
Count: 26688
Count: 26628
Count: 26628
Just tested my real PSRAM driver timing and found that my simulated numbers above were too aggressive as I suspected
For 128 byte transfers the total external RAM request servicing and transfer time from just before you issue the request at the client COG to when it is detected complete in the client COG ranges from 373-440 P2 clocks (average ~400). So I adjusted my simulated time and repeated the tests. I also found an error in my incmod instruction which actually wrapped from 0-10 not 0-9 as I wanted. This meant the tested data points above were not for 50%,60%,70%,80%,90%,100% hit rates, but were were actually collected for 5/11, 6/11, 7/11, 8/11, 9/11, 10/11's etc.
UPDATE: Here is the new chart (it seems somewhat steeper near 100% now which would make more sense):
The next thing I want to try (once the cache code is proven to work), is to run with the cache algorithm enabled and determine the true hit rate when running these tests. With this timing simulation using proper values I still don't really need to use external RAM yet for that type of testing. I can possibly try to vary cache line size from 64 to 128 to 256 to see what differences I get. Am thinking of using a 16-32kB i-cache. I do need block map memory too though and that depends on the total mapped external RAM accessible as execution memory as well as the block size. Right now its just one byte per block with up to 256 i-cache rows (255 usable). For 1MB of externally mapped memory and 256 byte blocks, that needs 4kB of HUB RAM.
Because of the large latency involved it might be better to use larger blocks, although that means you have less of them in the cache, and if you have a program with a large working set then you could start to thrash if you overload all cache rows.
Finally beaten a nasty bug on this caching code that has held me up for days...it was one of those bugs that if you change the code to try to add some extra code to debug it, the executable image moves about in memory and the problem changes to something else completely so I was chasing my tail for several days on this one. Unfortunately p2gcc has no debug() capabilities unlike PropTool and FlexSpin so I had to resort to limited serial printing from the VM with restricted room in there to code anything much to get a lot of data out, and if I recompiled and made it bigger the problem would morph again.
Anyway it's finally fixed now and I was able to use my external memory caching scheme to run MicroPython fully from the I-cache buffer in HUB RAM with the algorithm running. I'm seeing about 91% performance vs the original 100% hit rate numbers above when I run the same diags. They are quite small programs so they likely fit their working set into the 128 cache rows (of 256 bytes per row).
Even though this version does its "external" reads only from HUB RAM I do simulate the entire time to transfer from an external PSRAM and add in some latency clocks as well, so it should be comparable to the 32MB PSRAM on the P2 Edge.
setq2 #BLOCKSIZE/4-1
rdlong $100, extaddr
setq2 #BLOCKSIZE/4-1
wrlong $100, hubaddr
waitx ##BLOCKSIZE/2 ' delay to simulate extmem transfer @ p2clk B/s including LUTRAM transfers
waitx ##245-62 ' simulate remaining latency minus non-overlapping execution time already burned
It's quite snappy to interact with and you don't immediately notice any slow down when you use it from the console. I'm now going to try to tweak a few things to see the impact and mess about with some more MicroPython.
If the p2asm and p2link tools can be adjusted to keep data and code separated then in theory this would allow much larger heap sizes for native MicroPython. Something in the vicinity of 350-400kB or so perhaps depending on just how much data MicroPython itself uses (which I don't exactly yet know because its code and data are still merged together right now).
It works!!!! I am running native P2 code out of external PSRAM!
The native P2 MicroPython executable code is running by reading it from real external PSRAM into an I-cache in HUB RAM on demand. Cache row wraparound and branches are automatically handled, the code being executed doesn't know or care which row it is currently being run from.
It's still very snappy - this is at 252MHz :
run()
Testing 1 additions per loop over 10s
Count: 260758
Count: 260747
Count: 260748
Testing 2 additions per loop over 10s
Count: 192642
Count: 192651
Count: 192650
Testing 3 additions per loop over 10s
Count: 152750
Count: 152756
Count: 152756
Testing 10! calculations per loop over 10s
Count : 11237
Count : 11237
Count : 11237
Testing sqrt calculations per loop over 10s
Count: 119733
Count: 119308
Count: 119262
Comparison with my prior simulations of hit rate and transfer delay guesstimates shows we are operating near 100% for these simple demos which means its working set fits within the 32kB cache size for most of the time. That obviously will not always be the case.
To make this work I needed to make a few patches to the p2gcc toolchain, but no actual changes to MicroPython itself. Once in place, the executable code is agnostic to being operated from external RAM so long as ALTxxx, REP and other local branches are not used as they won't work if they cross cache row boundaries. These instructions are not being issued by the C-compiler so that is fine. Compilation still happens in LMM mode with all P2 branch and call instructions translated to use my hub-exec caching scheme by using some adjustments within s2pasm.
Ideally now we can split up the code and data segments, and find a good way to load code segments into external PSRAM from flash or SD perhaps. This would then allow very large (for a P2) C programs ~4MB-8MB to be compiled and run on the P2 with only moderate use (say < 64k) of HUB for I-cache structures, freeing it up for other COGs or larger data segment use.
UPDATE: Once I adjust for clock speed at 252MHz instead of 160MHz we had originally, these numbers are about 40% of full HUB exec MicroPython performance which is not too bad I guess and will still be useful. If running from external RAM runs yields peak performance in the vicinity of 50-70MIPS like this number indicates it would be decent for many applications. Of course this is the best case, not the worst case. Once that cache capacity is overwhelmed all bets are off.
This is really quite impressive, because it frees up hub ram once again, plus as you point out we can now load much bigger programs, seamlessly.
I know the MicroPython people have been targeting lean performance recently, it will be interesting to see how those gains also affect the overall performance, but 40% like you have at the moment is a surprisingly good starting point
Congrats Roger, really looking forward to seeing this in action.


Comments
I looked into this today, and it turns out it would need modifications to @"Dave Hein" 's great p2asm tool not just p2link for this. Probably quite a substantial effort if you don't know the code very well and I'm not willing to go there yet for testing this out as I won't easily know if the tool changes are causing bugs or my own external memory execution scheme itself.
So what I am hoping for now, just for my initial testing, is to just compile some smaller test programs as LMM and map 0x400 onwards to external memory for all code branches and jumps (instead of addresses above 1MB), while retaining the data in it's existing places in HUB RAM. So I will just copy the first 512kB of HUB RAM into external memory at the same addresses. That way I can at least try out my code to see if it gets read from external code and executed from i-cache while it can continue to read its data from the original HUB RAM addresses. The HUB RAM will obviously still have a copy of the executable image, it will just not be executed (if this scheme is working). I could probably even attempt to use my recompiled MicroPython image if it works out, and see just how much slower it runs.
Getting the overall image built, booting, spawning the memory driver COG and copying the image over into external RAM before starting it will be a requirement now, along with other steps I identified previously. Still quite a bit that has to go right to test this concept...
Also fixed a couple of bugs in my prior posted code which would not have worked correctly.
So I was able to modify s2pasm in the p2gcc toolchain to get my external memory scheme ready to test. It's still not quite complete integration as yet or ready to run but I can fully compile and link the entire MicroPython C codebase natively now using this method, so I know the process will let us translate nicely in LMM mode.
Here's an example of some MicroPython file translation from P1 code to P2 code. The "brs" is a pseudo branch instruction in LMM mode, and "lcall" is for calls. To keep p2asm happy I found I needed to use
callpa ##,Sinstead ofcallpa ##, #but that's okay, it only burns a few extra COG longs as storage for the jump pointers which we can spare, and doesn't slow it down.It would be nice to detect branches within the block, and use JMPs instead for those short jumps but that would require knowledge of the address, and the translation tool doesn't know this. However we might be able modify it in the assembler or linker as another optimization later once the address and distance is resolved. We'd hunt for cases of
callpa, ##addr, farjmpwhere the ## address value is within the same 256 byte block as this instruction itself and swap to a jmp ## using relative offsets (as well as NOPping out the prior AUGD).Have been bashing my way through this over the last 5 days trying to get something to execute using the new callpa #, farjmp method for jumps and calls/etc. I have had to make some mods to the p2gcc toolchain to get this point.
Specifically it turned out that P2ASM didn't like this way of doing things as it doesn't recognize the reference to main as a global function name, but more as a global data variable for CALLPA, even with an extern main() function prototype declared earlier in the file.
callpa ##main, farjmpWhat would happen is that it would create a symbol table variable called main and refer to it at address 0x800 (I've also moved the HUB start address from 0x400 to 0x800 now to make room in the VM COG for more external access instructions). The linker would try to update this to use the address of main when it finally determined it later, but would fail because the original symbol created for main was not of the type OTYPE_REF_AUGD. The failure to update would cause a jump to default address of 0x800 not the real address of the "main" entry point.
I made a hack in P2ASM just for the callpa #,# and callpb #,# instructions so it would call CheckVref when parsing the D field and it seemed to help...still testing it but my code at least now enters the main function (the actual external memory portion is bypassed for now, so I can prove the compilation itself works).
case TYPE_OP2DX: { CheckVref(i, tokens, num, 0); // <---------- NEW LINE ADDED value = EncodeAddressField(&i, tokens, num, 1, opcode, 1); opcode |= (value & 0x1ff) << 9; if (value & 0x200) opcode |= Z_BIT; if (CheckExpected(",", ++i, tokens, num)) break; ProcessRsrc(&i, tokens, num, &opcode); break; }This stuff is tricky. You have to dig into the inner workings of the p2asm and p2link stages and symbol table data to figure out what's up.
Finally got my
callpa #, farjmpmethods working with p2gcc after much pain figuring out why things wouldn't work and resorting to LED debug because even my UART code was broken as well.I found that
callpa ##$+8, farjmpsyntax would silently fail, as it would not have a proper label to compute the relative branch offset correctly created in the linker. This sort of code got used a lot to translate these SPIN1 LMM constructs to skip the next branch:cmps r0, #0 wz,wc IF_E add pc,#8 jmp #__LMM_JMP long .L251I wanted to translate the above SPIN1 code into this SPIN2:
    cmps    r0, #0 wz,wc
    IF_E    callpa ##$+8, farjmp
    callpa ##.L251
I know this is inefficent because a branch is taken in both cases of the if statement. Ideally we could just have this code generated from the GCC output, but we don't currently have that luxury as it was created with the P1 LMM VM in mind. Maybe I can muck about with s2pasm to get there eventually...
    cmps    r0, #0 wz,wc
    IF_NE    callpa ##.L251
So to quickly fix this issue I just created a farjmprel handler as well which would apply the PA register value as an offset to the current PC to get the branch address. This worked because the linker needed no relocation with it.
    cmps    r0, #0 wz,wc
    IF_E    callpa #8, farjmprel
    callpa ##.L251
So with this change my test code seems to work now and I can even run MicroPython with it (just executing indirect branches to HUB RAM - not yet external RAM):
# loadp2 -t build/python.bin
( Entering terminal mode.  Press Ctrl-] or Ctrl-Z to exit. )

#########################
# Native P2 MicroPython #
#########################
MicroPython v1.11-105-gef00048fe-dirty on 2022-02-24; P2 BOARD with Propeller2 P2X8C4M64P
Type "help()" for more information.


  help()


Welcome to MicroPython!

For online docs please visit http://docs.micropython.org/

Control commands:
  CTRL-A        -- on a blank line, enter raw REPL mode
  CTRL-B        -- on a blank line, enter normal REPL mode
  CTRL-C        -- interrupt a running program
  CTRL-D        -- on a blank line, exit or do a soft reset
  CTRL-E        -- on a blank line, enter paste mode

For further help on a specific object, type help(obj)
I should finally be able to test out my caching code experiment with an emulated external RAM transfer delay and just copy the code from the original HUB RAM address it is situated in to each cache line while still doing the actual caching of code. This simplifies the test setup because I don't have the luxury of having SPIN2 to set everything up in the p2gcc code environment and I won't have to mess about initializing external PSRAM or HyperRAM in my code at this point.
For reference I did our normal MicroPython benchmark with the indirect branches installed and got these results that follow. It would be good to compare this with the same when running from cache:
Thats quite a leap in one day, led debugging to compiled working micropython...
LOL. Sometimes progress can be non-linear once there's a breakthrough...
Also I just looked at the s2pasm changes to optimize those branches. I think something can be done there in the end to drop half these branches, that would help speed things up (and reduce code space by a long on each conditional branch like shown above). If a proper compiler was targeting this external memory mode tracked the block offset at each branch instruction generated, a simple local HUB-exec branch could be used whenever the branch target fell in the same block. That would be another speed up and can avoid checking the target block for every single branch, only needing to for those that jump out of the current block.
Wow, just made the change to the dual jumps on all IF conditions in s2pasm so only one of the conditions actually branches now and it sped things up nicely...check these results vs above. This would potentially be a good thing to include into the normal build at some point:
Note: this is running at 252MHz, so shouldn't be compared directly to the original tests we did way back for MicroPython at 160MHz.
With my indirect branch code now working, I was able to actually simulate the cache performance from external memory by introducing a delay representative of the external memory access delay and varying the hit ratio. I tried to use the same average clock delays that would emulate the current code overhead I have in my own cache control logic. The MISSDELAY is perhaps a bit ambitious if I use my current external memory driver COG but might be achievable if accessing the memory directly from the client COG (will have to check the expected latency for 256 byte transfers with my own COG and update with real world numbers). It's actually probably quite reasonable for 128 byte block transfers though with the same hit ratios.
Here's what I did...
farjmpis the indirect jump target for mycallpastuff doing normal branches. I also included the simulator call in the function calls and relative jumps too (not shown), so all branch types get covered. I didn't simulate the intra-block jump optimization which is actually a slightly faster case in my own code because it can avoid a HUB memory access, but that would only increase the performance slightly.CON HITRATE = 6 HITDELAY = 20 MISSDELAY = 320 DAT ... farjmp long farbranch farbranch call #simulator pop ina jmp pa simulator incmod cachehits, #10 ' count to ten to give 10% steps for testing cmp cachehits, #HITRATE wc if_c waitx ##HITDELAY if_nc waitx ##MISSDELAY ret wcz cachehits long 0With this simple simulation code included I collected some MicroPython benchmark results for different cache hit ratios. This is reasonably accurate in terms of additional overhead time for branches however the distribution of where the overhead happens is not the same as what would happen in the real world. Despite that it is still useful and represents the proper hit/miss ratio timing added to the code. Also this does not take into account the extra overhead of bringing in a new row every 256 bytes as you execute past the boundary, however that is not expected to be too significant compared to the actual cache hit/miss stuff, and it is quite likely you would have already branched out before you reach the end of the cache row anyway.
Here are the results I obtained for different hit ratios :
50%
60%
70%
80%
90%
100%
For fun I also simulated 0% cache hit rate (all external memory accesses for every branch). Surprisingly it still functioned reasonably well (less than 10x slower than native, which is still quite usable):
0%
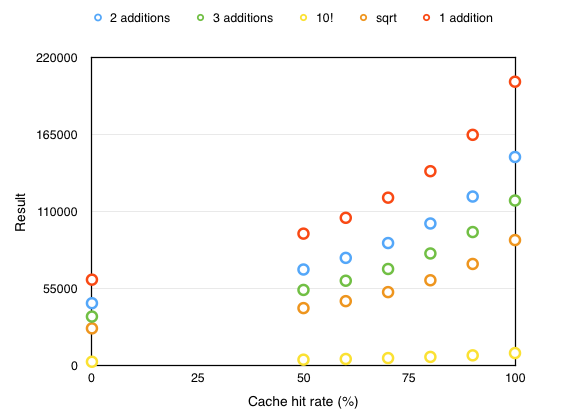
Here are the values plotted. It's certainly non linear as expected.
Just tested my real PSRAM driver timing and found that my simulated numbers above were too aggressive as I suspected
For 128 byte transfers the total external RAM request servicing and transfer time from just before you issue the request at the client COG to when it is detected complete in the client COG ranges from 373-440 P2 clocks (average ~400). So I adjusted my simulated time and repeated the tests. I also found an error in my incmod instruction which actually wrapped from 0-10 not 0-9 as I wanted. This meant the tested data points above were not for 50%,60%,70%,80%,90%,100% hit rates, but were were actually collected for 5/11, 6/11, 7/11, 8/11, 9/11, 10/11's etc.
UPDATE: Here is the new chart (it seems somewhat steeper near 100% now which would make more sense):
If you used a free online chart maker, which one was it?
I'm thinking it's just an exported spreadsheet chart.
LOL. It's just Numbers charts on a Mac.
I win") - https://en.wikipedia.org/wiki/Numbers_(spreadsheet)
- https://en.wikipedia.org/wiki/Numbers_(spreadsheet)
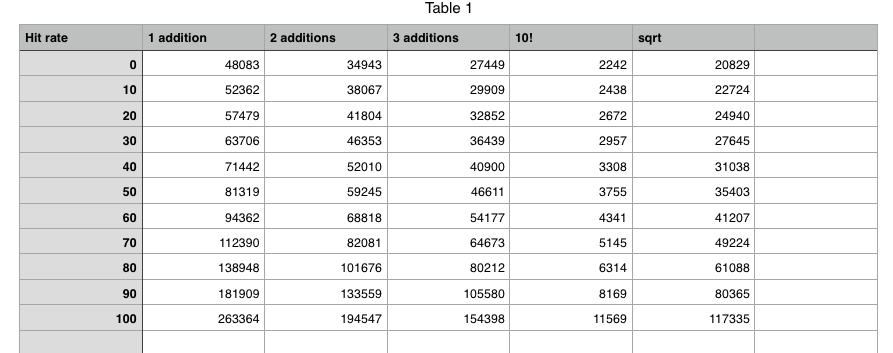
Here's the raw data...
The next thing I want to try (once the cache code is proven to work), is to run with the cache algorithm enabled and determine the true hit rate when running these tests. With this timing simulation using proper values I still don't really need to use external RAM yet for that type of testing. I can possibly try to vary cache line size from 64 to 128 to 256 to see what differences I get. Am thinking of using a 16-32kB i-cache. I do need block map memory too though and that depends on the total mapped external RAM accessible as execution memory as well as the block size. Right now its just one byte per block with up to 256 i-cache rows (255 usable). For 1MB of externally mapped memory and 256 byte blocks, that needs 4kB of HUB RAM.
Because of the large latency involved it might be better to use larger blocks, although that means you have less of them in the cache, and if you have a program with a large working set then you could start to thrash if you overload all cache rows.
Finally beaten a nasty bug on this caching code that has held me up for days...it was one of those bugs that if you change the code to try to add some extra code to debug it, the executable image moves about in memory and the problem changes to something else completely so I was chasing my tail for several days on this one. Unfortunately p2gcc has no debug() capabilities unlike PropTool and FlexSpin so I had to resort to limited serial printing from the VM with restricted room in there to code anything much to get a lot of data out, and if I recompiled and made it bigger the problem would morph again.
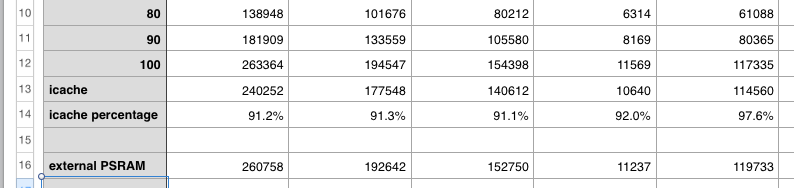
Anyway it's finally fixed now and I was able to use my external memory caching scheme to run MicroPython fully from the I-cache buffer in HUB RAM with the algorithm running. I'm seeing about 91% performance vs the original 100% hit rate numbers above when I run the same diags. They are quite small programs so they likely fit their working set into the 128 cache rows (of 256 bytes per row).
Even though this version does its "external" reads only from HUB RAM I do simulate the entire time to transfer from an external PSRAM and add in some latency clocks as well, so it should be comparable to the 32MB PSRAM on the P2 Edge.
                setq2  #BLOCKSIZE/4-1
                rdlong $100, extaddr
                setq2  #BLOCKSIZE/4-1
                wrlong $100, hubaddr
                waitx   ##BLOCKSIZE/2 ' delay to simulate extmem transfer @ p2clk B/s including LUTRAM transfers

                waitx   ##245-62 ' simulate remaining latency minus non-overlapping execution time already burned
It's quite snappy to interact with and you don't immediately notice any slow down when you use it from the console. I'm now going to try to tweak a few things to see the impact and mess about with some more MicroPython.
If the p2asm and p2link tools can be adjusted to keep data and code separated then in theory this would allow much larger heap sizes for native MicroPython. Something in the vicinity of 350-400kB or so perhaps depending on just how much data MicroPython itself uses (which I don't exactly yet know because its code and data are still merged together right now).
It works!!!! I am running native P2 code out of external PSRAM!
The native P2 MicroPython executable code is running by reading it from real external PSRAM into an I-cache in HUB RAM on demand. Cache row wraparound and branches are automatically handled, the code being executed doesn't know or care which row it is currently being run from.
It's still very snappy - this is at 252MHz :
Comparison with my prior simulations of hit rate and transfer delay guesstimates shows we are operating near 100% for these simple demos which means its working set fits within the 32kB cache size for most of the time. That obviously will not always be the case.
To make this work I needed to make a few patches to the p2gcc toolchain, but no actual changes to MicroPython itself. Once in place, the executable code is agnostic to being operated from external RAM so long as ALTxxx, REP and other local branches are not used as they won't work if they cross cache row boundaries. These instructions are not being issued by the C-compiler so that is fine. Compilation still happens in LMM mode with all P2 branch and call instructions translated to use my hub-exec caching scheme by using some adjustments within s2pasm.
Ideally now we can split up the code and data segments, and find a good way to load code segments into external PSRAM from flash or SD perhaps. This would then allow very large (for a P2) C programs ~4MB-8MB to be compiled and run on the P2 with only moderate use (say < 64k) of HUB for I-cache structures, freeing it up for other COGs or larger data segment use.
UPDATE: Once I adjust for clock speed at 252MHz instead of 160MHz we had originally, these numbers are about 40% of full HUB exec MicroPython performance which is not too bad I guess and will still be useful. If running from external RAM runs yields peak performance in the vicinity of 50-70MIPS like this number indicates it would be decent for many applications. Of course this is the best case, not the worst case. Once that cache capacity is overwhelmed all bets are off.
This is really quite impressive, because it frees up hub ram once again, plus as you point out we can now load much bigger programs, seamlessly.
I know the MicroPython people have been targeting lean performance recently, it will be interesting to see how those gains also affect the overall performance, but 40% like you have at the moment is a surprisingly good starting point
Congrats Roger, really looking forward to seeing this in action.
(Editor slow, I will try this again tomorrow, post got mangled fubar... )
Disable scripting until it's needed. And then disable it again afterward.
Hmm, I should pester admin about getting the syntax highlighting module removed. Apparently that's the faulty script.