Picture of Sound - Parallax Propeller P2 as a Tool to Analyse a Guitar Effect Pedal or an Amp


For this project P2 was chosen, because
- it's built in programmable gain ADC makes it simple to sample audio in a broad range of amplitude levels with acceptable signal to noise ratio. Only very simple additional hardware is needed.
- it has multiple cores, which make it simple to generate and sample audio in parallel and even have life VGA graphic output.
- sufficient RAM for buffers and for a 640*360 resolution picture with 256 colors.
- it's cordic solver is usable for hardware multiply, divide and hardware sine generation. For the display it's log is handy.
How does it work?
P2 is under control of Taqoz Forth which provides it's interactive user interface via terminal.
A sine signal of known frequency and amplitude is generated and fed into the device under test.
The devices output is sampled and analysed using a Goertzel algorithm, similar to fft, to get the magnitude of the test frequency and its 2nd and 3rd harmonics together with the overall amplitude. Each combination of test amplitudes with test frequencies builds the basis of one square data point and many of them build the diagram.
P2 prints the values after Goertzel analysis to serial terminal Teraterm in csv format. A Python script using numpy and matplotlib is used to generate the final picture.
What's in the Picture-of-Sound diagram?
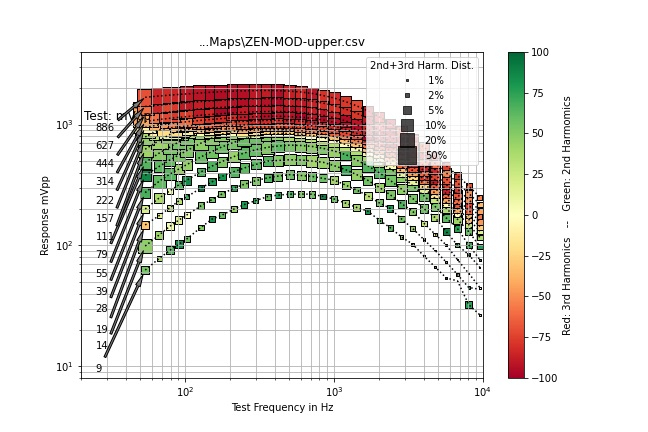
- The horizontal axis is the test frequency in Hz, which is also the base frequency for the analysis.
- The vertical axis is the output amplitude of the device in mV-peak-peak.
- The numbers 9, 14, 19, 28, .... 886 within the diagram on the left side are the test amplitude levels in mVpp. So the test levels range from 9mVpp....886mVpp.
- The dotted lines give the frequency responses as amplitude in mVpp. Each line uses the same test level in mVpp as input to the device.
- If the dotted lines come together more closely, there is compression of volume levels.
- The size of the squares give the sum of the 2nd+3rd harmonic's magnitudes in relation to the base magnitude in percent. This represents the amount of harmonic distortion.
- The color of the squares give (2nd-3rd)/(2nd+3rd) the relative amount of the 2nd or the 3rd harmonic. This is interesting, because the 2nd harmonic is just the octave, which will make the sound "rich", while the 3rd harmonic will give a more aggressive sound.
So in the picture above, we can see, that there is emphasis of frequencies around 500Hz. At low levels 2nd harmonics are present and dominating, while at high input levels 3rd harmonics take over.
This is an analysis of an effect called ZEN. https://www.musikding.de/docs/musikding/zen/ZenV2_schalt.pdf The 2nd harmonics are generated by the asymmetric soft clipping around D1, D2, D3 in the schematic.
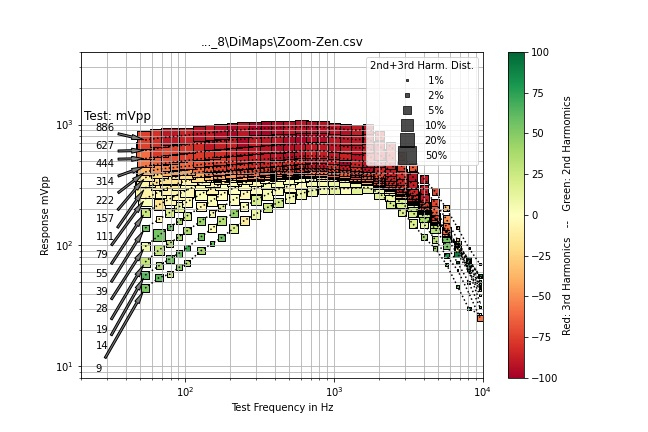
To show something different, this is the Picture of a Zoom Marshall MS1959 ("This models the sound of the Marshall 1959 SUPER LEAD 100") and it's 4*12 Stack:
Thanks to many people here: Peter for Taqoz Forth, Bob for it's documentation, ManAtWork and ErNa for the Kiss board. Evanh and all the others for insight into P2...
If you are interested in the results and more pictures, you are welcome to join in at: https://www.musikding.rocks/forum/index.php?thread/420821-picture-of-sound-make-visible-the-behaviour-of-an-overdrive-or-an-amp/#post451686
Have Fun, Christof


Comments
Awesome project Christof. Well done
Cool! That's seeing a project through. There sure is some great projects popping out of the woodwork.
How fast is the updating of the live display?
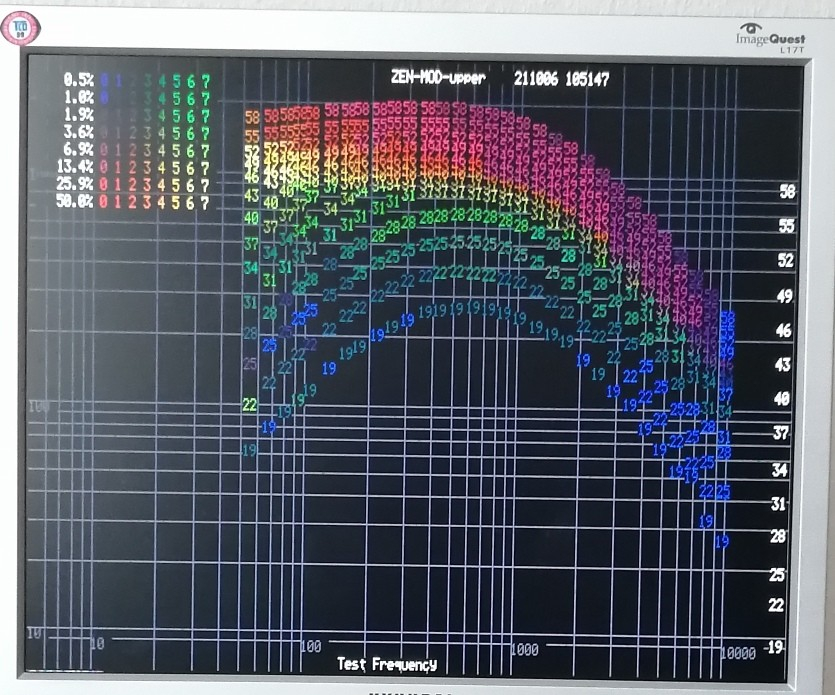
The timing is dictated by the sampling of a 4k buffer per data point. It has to be long enough to catch low frequencies. It takes ~0.1 sec. Analysis is faster ~0.04sec . Plotting the data on VGA takes ~0.1 sec too, but this is handed over to an additional cog, so the next sampling can be done in parallel. It would be possible to do analysis and next sampling in parallel too. As most time is needed to prepare the effect and type in the name of the effect device, copy data, save data in a csv file, it would be significantly faster to control P2 not via the terminal but via the Python script, which could send Taqoz Forth commands. Lots of things to optimise. But I wanted to see results finally. :-)
...
Oh, I did certainly have fun and I think more fun is ahead and useful information as well.
As a side note, I noticed you started the discussion on the musikding.rocks in English, which obviously helps, making the subject more accessible to the non-German speakers. Some of the discussion will require additional skills for many to digest but that is fine too . Thanks for sharing.
An easy 5 Hz then. Groovy to watch. I always get fascinated with live displays like that. I'm assuming it'll run until you stop it to store results.
Yes, these forums have a small regular membership, so it is not very likely, that someone is interested at this very moment. Perhaps in a few months or years...??
:-)
I wonder if this could be used to compare a modelled rig with the original?
So often, a purist has been caught-out, making a positive comment regarding a particular "tone" and when informed that it was a simulation...."ah yeah, I hear it now...it sounds digital"
Yes, this diagrams are meant to compare and to have a common basis for communication and discussion. Like always this will only work, if both partners are willing to use/accept the basis.
Zen Emulated from Zoom G3n:

Zen Clone built with hardware by me:

( Just as a information, what Zen is. Here is a video of the original:)
 )
)
Well actually for me and my ears the hardware version sounds "sweeter" corresponding to the colours of these diagrams. The emulated version sound too harsh for me. I have not yet heard a youtube video, that does contradict this. And I have not really found that for example Line6 can do it better.
So I would tend to use overdrive/distortion as real hardware. Here I like JFET emulations of tube amps. They are low voltage and cheap and easy to build and have -for my ears- a very nice tone.
Of course for reverb/echo digital effects can be very cool and the flexibility and low weight of digital effects are simply great.
Of course there is a whole industry, who want to sell boutique pedals and amps and print/show reviews....
I find it interesting, that Zoom have introduced "new" amps "Krampus" in G11 to get out of this discussion. It's no longer "Does it really sound like xyz?" but "Does it sound right for this song?"
Zoom emulation:
Are we literally seeing compression here?
I think a lot of people, in the industry, would be interested in this tool
I have finally succumbed to using "custom backing tracks" from https://www.karaoke-version.co.uk/
I "solo" and download each track and import to Reaper DAW to reconstruct the backing track to suit (eliminating the ridiculous orchestra, etc.) . In many cases, I re-record the guitar tracks myself and in order to make the backing not sound detached (faked) from my live guitar, I have to come up with the ideal "amp" settings.
I find myself moving more and more to a fully computerised rig for my solo-gig setup because everything needs to be a preset. Don't want to be twisting knobs on a floor-based device
Certainly, but that interest from one industry group will surely go against the interest of the other one.
That being said, both groups will likely want to either use the tool or to prevent the use of it and the author of that nifty tool (and the tool itself) could potentially be loved and hated at the same time by both.
But it's too late now for the three of them !
Or maybe not. I'm not a lawyer so I can't really tell.
This is really a great project that showcases both TAQOZ Forth and the P2, imho.
This is a great Prop2 demo, and I love the information content of the data display. I'm wondering how you could add intermodulation distortion to that.
Yes, intermodulation distortion. :-)
 Define the type of measurement
There are 3 steps to be done:
A) Define/Fix Parameters of the test signal from all the possible combinations
C) Define the way to graph.
At the moment for A) I think it would be good to use 2 sine signals with fixed relation of amplitudes and fixed frequency relation as a power chord (quint). https://www.ampbooks.com/mobile/tutorials/imd/
One hurdle will be, that the sub octave, which is generated from the intermodulation, is more difficult to measure. The existing setup works not very good with f<80Hz. At least it would be necessary to increase the length of measurement time.
At the moment I am not sure, if the measurement of intermodulation distortion is additional or redundant information to the already existing picture. At least for both the symmetry of the circuit or of the saturation seems to be very relevant.
I am blown away by a product "MIDI Guitar" by jamorigin.com
Using a standard guitar pick up (not a separate hex pick up), it is able to decipher each fretted note and convert it to MIDI.
IIRC, 3-note polyphonic
It takes some time to master the playing technique but it really is amazing. Only downside is that a PC/iPad is required.
Do you think that a standalone P2-based design is within the realm of possibility?
Hi Mickster,
as this is a different project, it would be good to have this in it's own thread.
I did watch the video and did a google search. Something like this has been done with other microcontrollers. I assume, that it (sound to midi) would be doable with P2 and it's ADC. Perhaps a hardware compressor would help.
The big question would be latency. Actually they did the demo with "swelling sounds", which hide latency. In my project, I want to measure small signals, so I use 32bit math using cordic multiply. For 9 Goertzel frequencies, I think it needs about 40ms using one cog. For all possible base frequencies of a guitar it would need correspondently longer. I think, it would be good to go down here to 16bit, to be able to use mul16. I am not sure, if fft or autocorrelation would be better here too. FFT needs the complete sample, Goertzel can work during sampling. Perhaps separate parallel samplings with different sampling rates would be good to reduce the number of points per sample.
So good luck!