

MQ-7 CO gas sensor (27931)
 mizzard
Posts: 5
mizzard
Posts: 5
Hello, in the following threat there are conclusions and questions after this one:
http://forums.parallax.com/showthread.php?139125-HSW-signal-on-MQ7-CO-gas-sensor-(27931)
We have bought 3 of your MQ-7 CO sensor from Parallax Inc distributor (Parallax reference: 27931):
http://www.parallax.com/StoreSearchResults/tabid/768/txtSearch/gas/List/0/SortField/4/ProductID/547/Default.aspx
and made some tests, and we have some questions (see attached files).
First of all we are going to explain our tests. We made a program into microcontroller to do the 2 phases (heating, during 60 seconds and sensing, during 90 seconds).
Thank you so much.
http://forums.parallax.com/showthread.php?139125-HSW-signal-on-MQ7-CO-gas-sensor-(27931)
We have bought 3 of your MQ-7 CO sensor from Parallax Inc distributor (Parallax reference: 27931):
http://www.parallax.com/StoreSearchResults/tabid/768/txtSearch/gas/List/0/SortField/4/ProductID/547/Default.aspx
and made some tests, and we have some questions (see attached files).
First of all we are going to explain our tests. We made a program into microcontroller to do the 2 phases (heating, during 60 seconds and sensing, during 90 seconds).
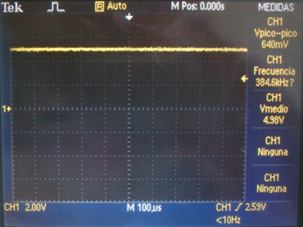
- You can see heating signal on H pin (MQ-7 sensor) in attached PNG figure 1. On voltage level is constant to 4.98 V during 60 seconds.
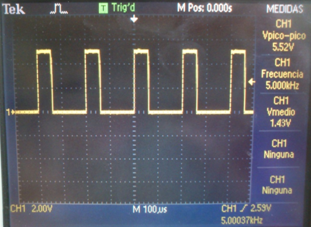
- In figure 2, you can see a PWM signal with average value aprox to 1.43 V, that is sensing phase during 90 seconds.
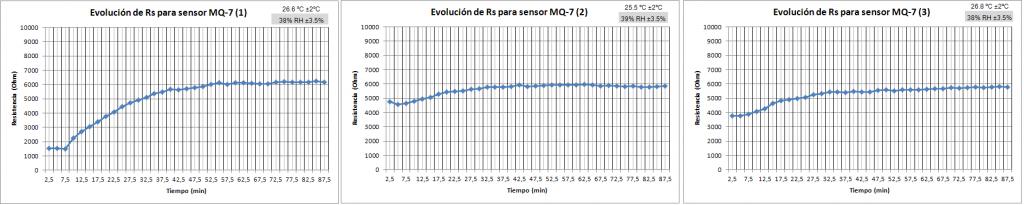
- At 85 seconds of sensing phase we use a analog input pin of microcontroller and an ADC, taking 30 samples and do it the average of them. We repeat this step every 85 seconds of sensing phase during 35 times.We repeat both phases continuously during our experiment. After that, we use the proposed equation Rs\RL = (Vc-VRL) / VRL, where RL is aprox 10 KOhm. We show the evolution of Rs value in figure 3.
- In figure 3, you can see the results for the three differents MQ-7 sensors, where vertical axis means resistor in ohms and horizontal axis means time in minutes. Additionally you can see temperature and humidity for each test.
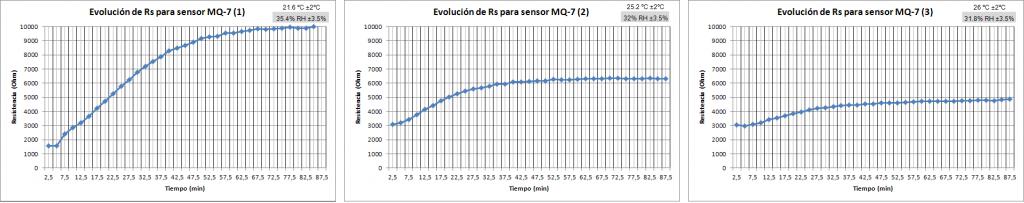
- In figure 4, you can see the same experiment as figure 3 for the same 3 MQ-7 sensors. This test was done a week later without using the sensors.
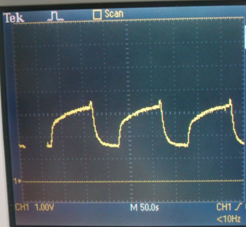
- In figure 5 you can see the evolution of the voltage on RL, (TP1 test point in Parallax PCB):
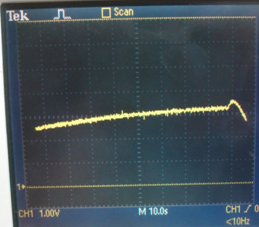
- In figure 6 you can see a zoom of the end of sensing phase.
- Is normal that in figure 3 all sensors were stable about 6000 ohms and in second test there is no relation between them?
- Is normal that it is necessary to wait about an hour to see stable results?
- Why we can see on figure 5 the wave like 100 ppm of CO (sensor datasheet) if all test were done inside the lab? (supposed no CO gas in air).
- Is it necessary to use a high frequency filter to stabilize the signal on figure 6?
- Our tests are during about 87,5 min (figures 3 and 4). Is it necessary to repeat them waiting for more time?
- Could we have some more information about the value of Ro in ohms? The main reason is because we want to estimate the level of CO in ppm in the air and we can't know it using the information of the datasheet.
Thank you so much.
303 x 227 - 152K
311 x 227 - 162K
1024 x 205 - 51K
1024 x 203 - 51K
246 x 227 - 128K
259 x 227 - 128K
Comments
It is not unusual at all for this type of sensor to take an hour to settle down. They really need to run continously. What would they do if they all ran continuously for the week instead of being put aside? The amount of variation from one week to the next for each sensor is puzzling, so you are right to wonder why.
Your idea to take the measurement at around 85 seconds out of 90 in each cycle seems reasonable enough. Just as long as it is consistent. As you noticed, there is a lot of change during that 90 seconds and it is still changing at the end. The data sheet is not clear about when to take the measurement.
As to the value of Ro, that is the million dollar question. You have to have a known calibration source of CO in order to determine that! Each MQ-7 sensor will be different. The normal levels in a lab or home will be (should be!) well below the level that this sensor can detect and discriminate. It's lower limit implied in the data sheet is around 50ppm, which is where it begins to be dangerous for continuous exposure. Do read wiki and other sources about carbon monoxide and levels that can occur under different conditions. Y buena suerte con el proyecto!