

Propeller based boat flow meter

This is what I have been trying to achieve with a Propeller protoboard, a Parallax Micro SD card interface, Parallax GPS and a bunch of LED's and switches.
The aim was to have a means of monitoring the fuel remaining in my boat and to gain an understanding of how fuel burn changes with speed and load. It is not supposed to be highly accurate, but to help planning and economy whilst giving an idea of when I need to change tanks.
Proprietary fuel monitoring systems are expensive and I wanted something to log data so that I could characterise the boat and engine given the number of passengers, etc., It doesn't however, take trim position or loading into account, so it won't be perfect. I have a 11 yr old son who likes to tootle along at no more than 10 mph (at which speed the boat is mushing through the water in a very inefficient way) and his 9 yr old sister who goes everywhere at 40kts (both under supervision, I hasten to add!) - there must be a 'best range' speed between these two extremes.
What it does:
The code and a calibration constant are installed on the SD card, making it possible to update the code without taking a laptop to the boat. The calibration constant matches the sensor to the software. With the flow sensor I am using one pulse is nominally created for every 0.4 ml of fluid - a calibration constant of '394' (i.e., 0.394 ml) has been found to match displayed used volume with actual volume for 25l of water.
Using three digits for the constant allows for quite a bit of fine tuning.

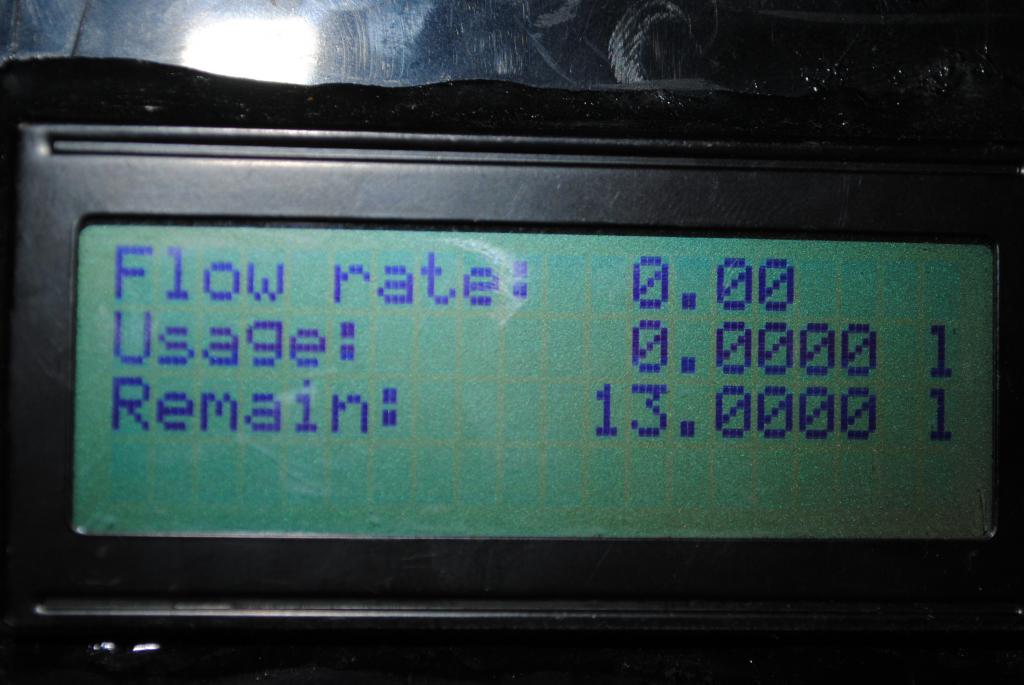
Screen 1: Usage data
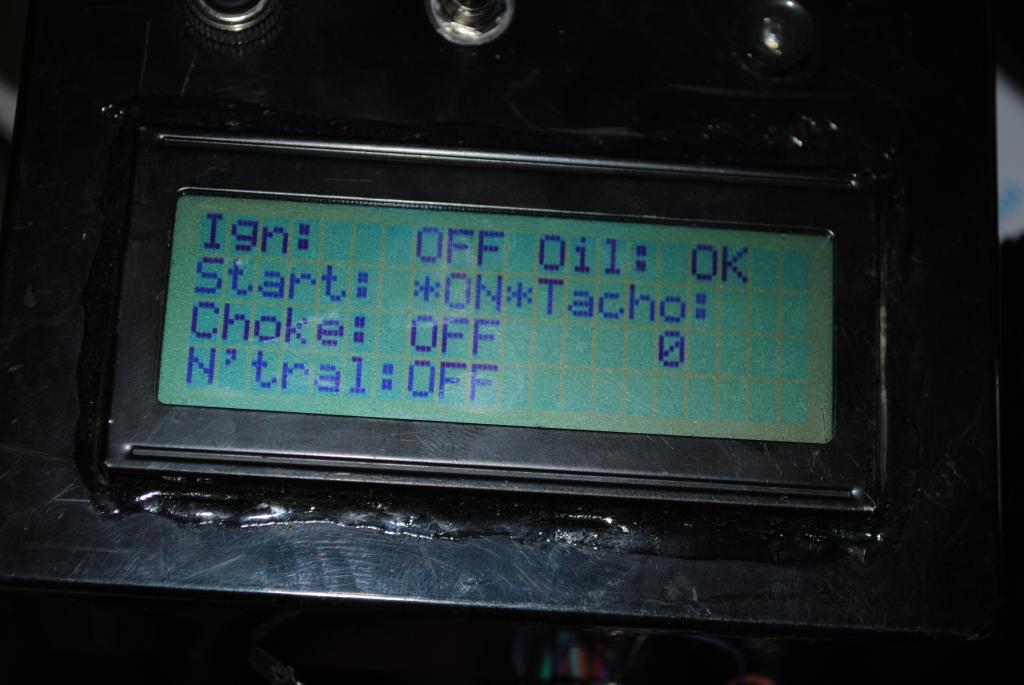
Screen 2: Switch status

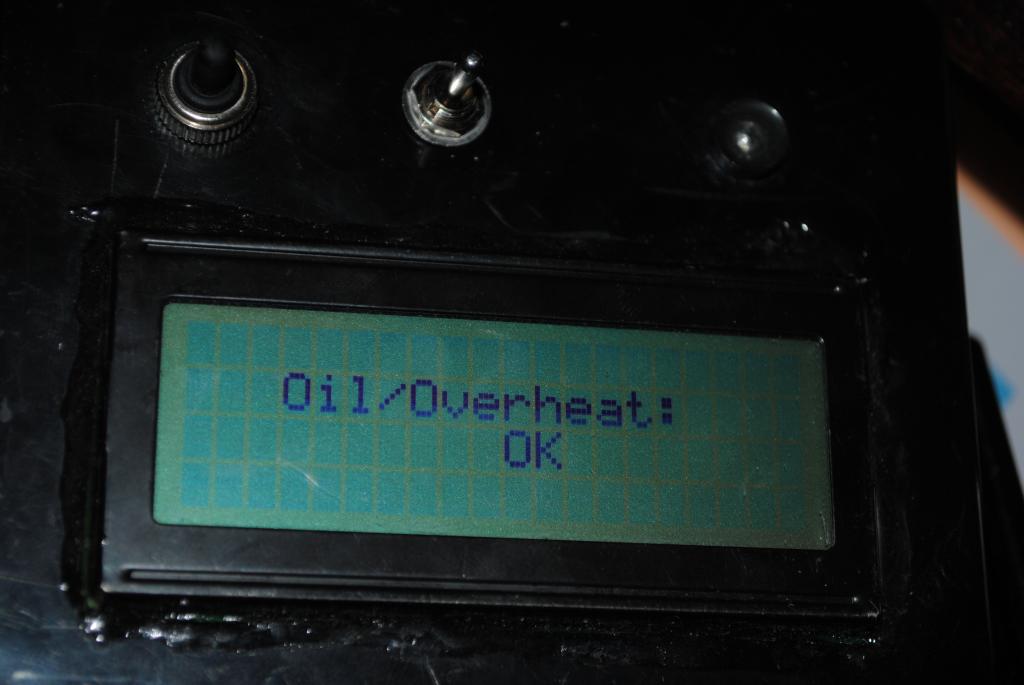
Screen 3: Overheat warning

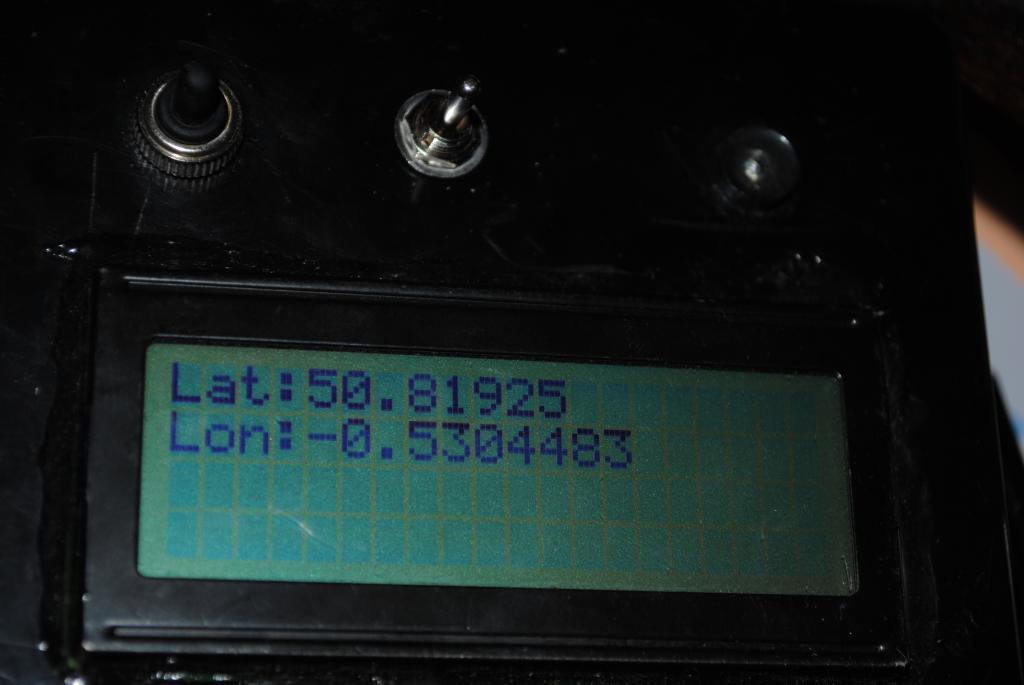
Screen 4: GPS position data
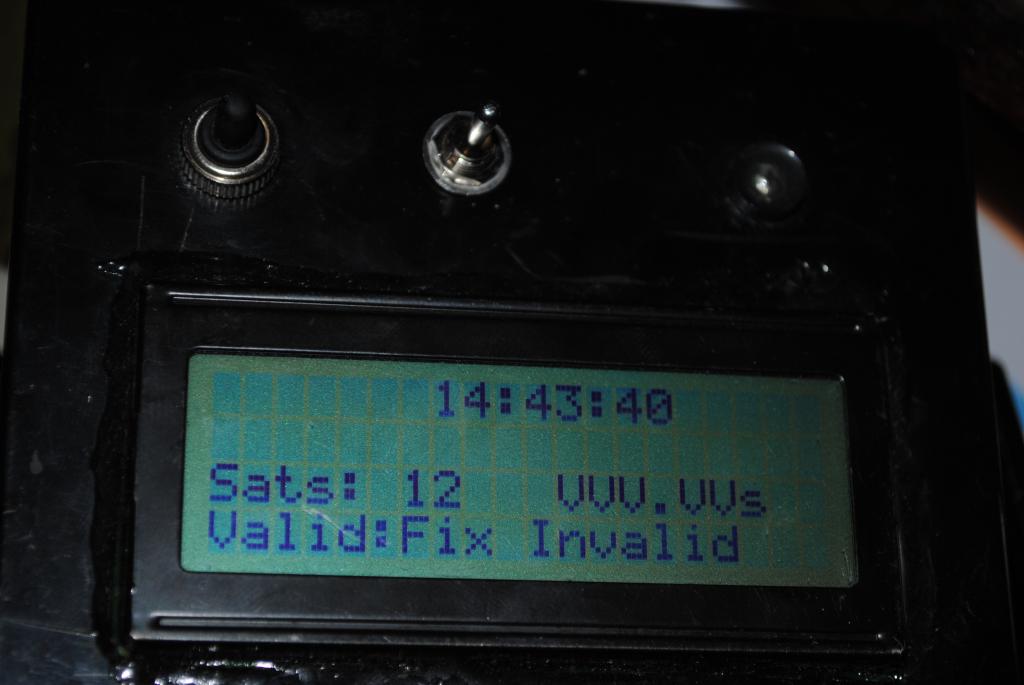
Screen 5: GPS data

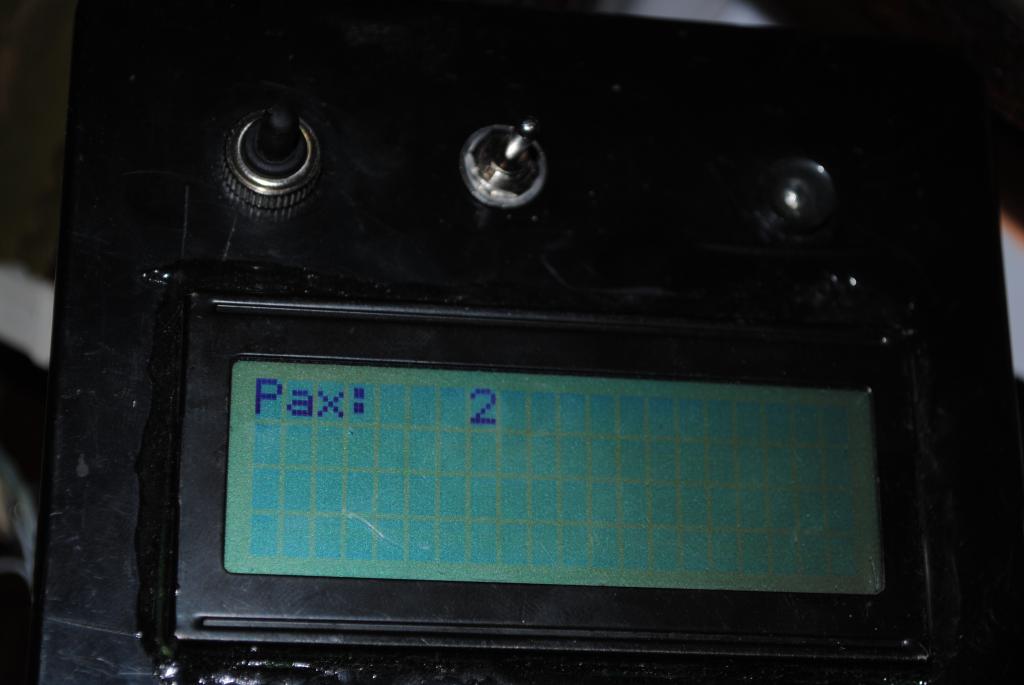
Screen 6: Passenger data
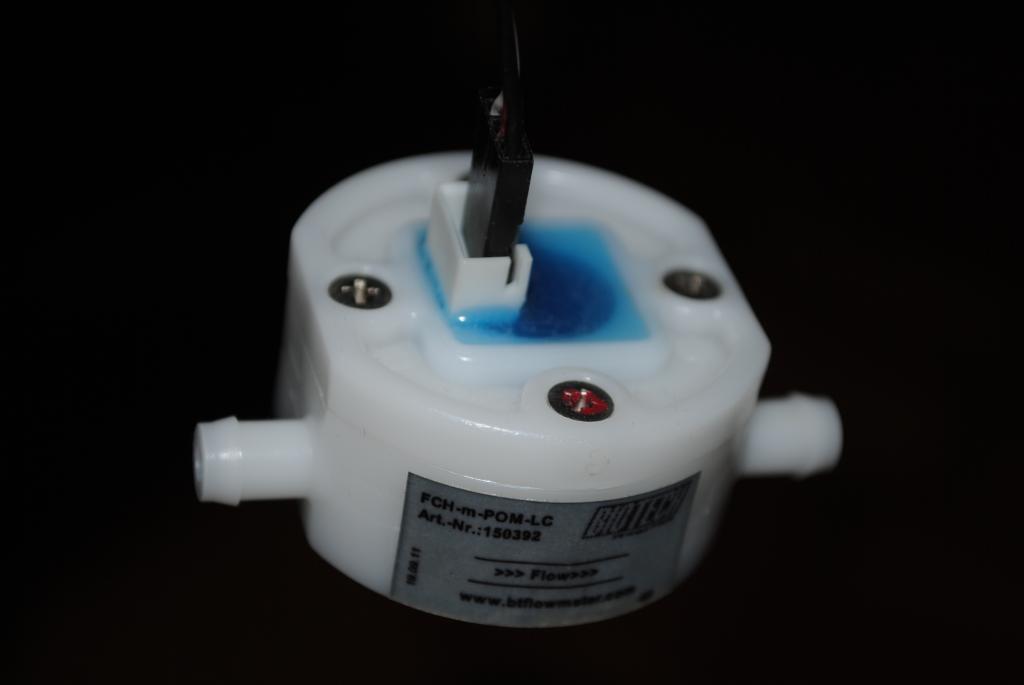
Screen 7: Fuel-proof flow sensor

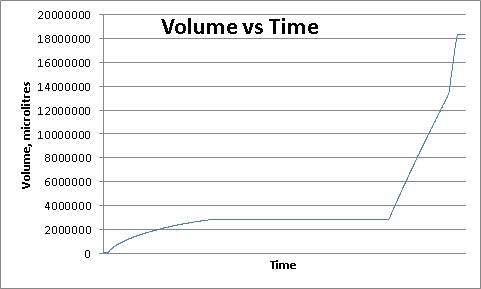
Screen 8: Data from a test over low and high flow rates.
Once it matures, future changes might include automatic control of a pump to transfer between tanks. I think I have four free pins!
Its been an interesting project and being able to dedicate a cog just to counting pulses makes it much more straightforward than using interrupts, etc.
The aim was to have a means of monitoring the fuel remaining in my boat and to gain an understanding of how fuel burn changes with speed and load. It is not supposed to be highly accurate, but to help planning and economy whilst giving an idea of when I need to change tanks.
Proprietary fuel monitoring systems are expensive and I wanted something to log data so that I could characterise the boat and engine given the number of passengers, etc., It doesn't however, take trim position or loading into account, so it won't be perfect. I have a 11 yr old son who likes to tootle along at no more than 10 mph (at which speed the boat is mushing through the water in a very inefficient way) and his 9 yr old sister who goes everywhere at 40kts (both under supervision, I hasten to add!) - there must be a 'best range' speed between these two extremes.
What it does:
- It taps into the boat wiring and provides an LCD display of the state of various switches, together with an LED telltale.
- The user can set the initial contents of the fuel tank in 1 litre increments.
- The user can set the number of passengers pressent.
- The user can move between the various screens at will, or the code will bring up the relevant screen in the event of an alert.
- One of the Propeller cogs sits there and only waits for the pulses from the flow sensor. When a pulse occurs it increments the 'fuel consumed' data and decrements the 'fuel remaining' data.
- Using the Propeller counter as a time reference, the rate of fuel consumption is calculated and displayed.
- GPS position and other data can be shown to the user.
- GPS position, fuel quantity and GPS speed are logged to the SD card at 1Hz, for subsequent analysis in slow time.
The code and a calibration constant are installed on the SD card, making it possible to update the code without taking a laptop to the boat. The calibration constant matches the sensor to the software. With the flow sensor I am using one pulse is nominally created for every 0.4 ml of fluid - a calibration constant of '394' (i.e., 0.394 ml) has been found to match displayed used volume with actual volume for 25l of water.
Using three digits for the constant allows for quite a bit of fine tuning.
Screen 1: Usage data
Screen 2: Switch status
Screen 3: Overheat warning
Screen 4: GPS position data
Screen 5: GPS data
Screen 6: Passenger data
Screen 7: Fuel-proof flow sensor
Screen 8: Data from a test over low and high flow rates.
Once it matures, future changes might include automatic control of a pump to transfer between tanks. I think I have four free pins!
Its been an interesting project and being able to dedicate a cog just to counting pulses makes it much more straightforward than using interrupts, etc.


Comments
What a great and practical project. This seems like a perfect fit for the Propeller.
Thank you for documenting it. I hope you share what you learn from it with us.
Can you post a link for this Fuel-proof flow sensor and the code that you used? I have been with a group that has been restoring the Perfect Storm ship Zuni/Tamaroa and a project like yours is perfect for our group in monitoring our fuel usage of our generators.
This one specifically states petrol (gas). There are some black plastic ones being touted on eBay but I found they caused too much of a pressure drop.
Hope this helps,
Hugh
Because one is cog dedicated to measuring the pulses from the flow sensor and another cog is dedicated to writing data to the SD card they are completely unaffected by all the faffing about involved in drawing this chart. Thank goodness for the Propeller!
BOAT16 - Archive [Date 2012.01.24 Time 13.39].zip
I think this project will be modifiable to accomodate two sensors. I won't need the switch display, but I will probably include the GPS module to have the ability to do time/speed/distance/fuel calcs. This will definitely give me a good start, anyway. Thank you for publishing it.
Blimey, that sounds a nice boat - I am glad I'm not paying for the fuel though! 55 litres in my boat costs 79 GBP or about $125.
Some tweaked code is attached.
It took me a while to come up with a calibration factor so that the 'measured' values tied in with how much fuel it took to brim the tank.
I've got a fair amount of coverage, but I will have to statistically weight the data based upon the number of data points at each speed / burn combination because there is a lots of spread due to trim, etc.,
(Vertical axis is burn rate in a non-specific unit, horizontal axis is speed in kts)
Taken as the difference in 'burn' between two points in time, the rate is quite 'noisy'
(Blue plot is total burn (rightmost axis), red is 'rate' (leftmost axis))
I pick up the GPS data from the NMEA0183 output of my nav GPS.
BOAT22 - Archive [Date 2012.06.22 Time 16.01].zip