Use MATLAB to monitor and change spin variables/arrays
Thanks to the inspiration and help from Henry, the latest ViewPort Client Kit now includes sample code for:
MATLAB
python
C#
vb.net
Excel
The documentation describes how to use either DDE (built into many Windows applications), or the vpClient.DLL to monitor variable and arrays, change variables, set trigges, load spin files, and more.
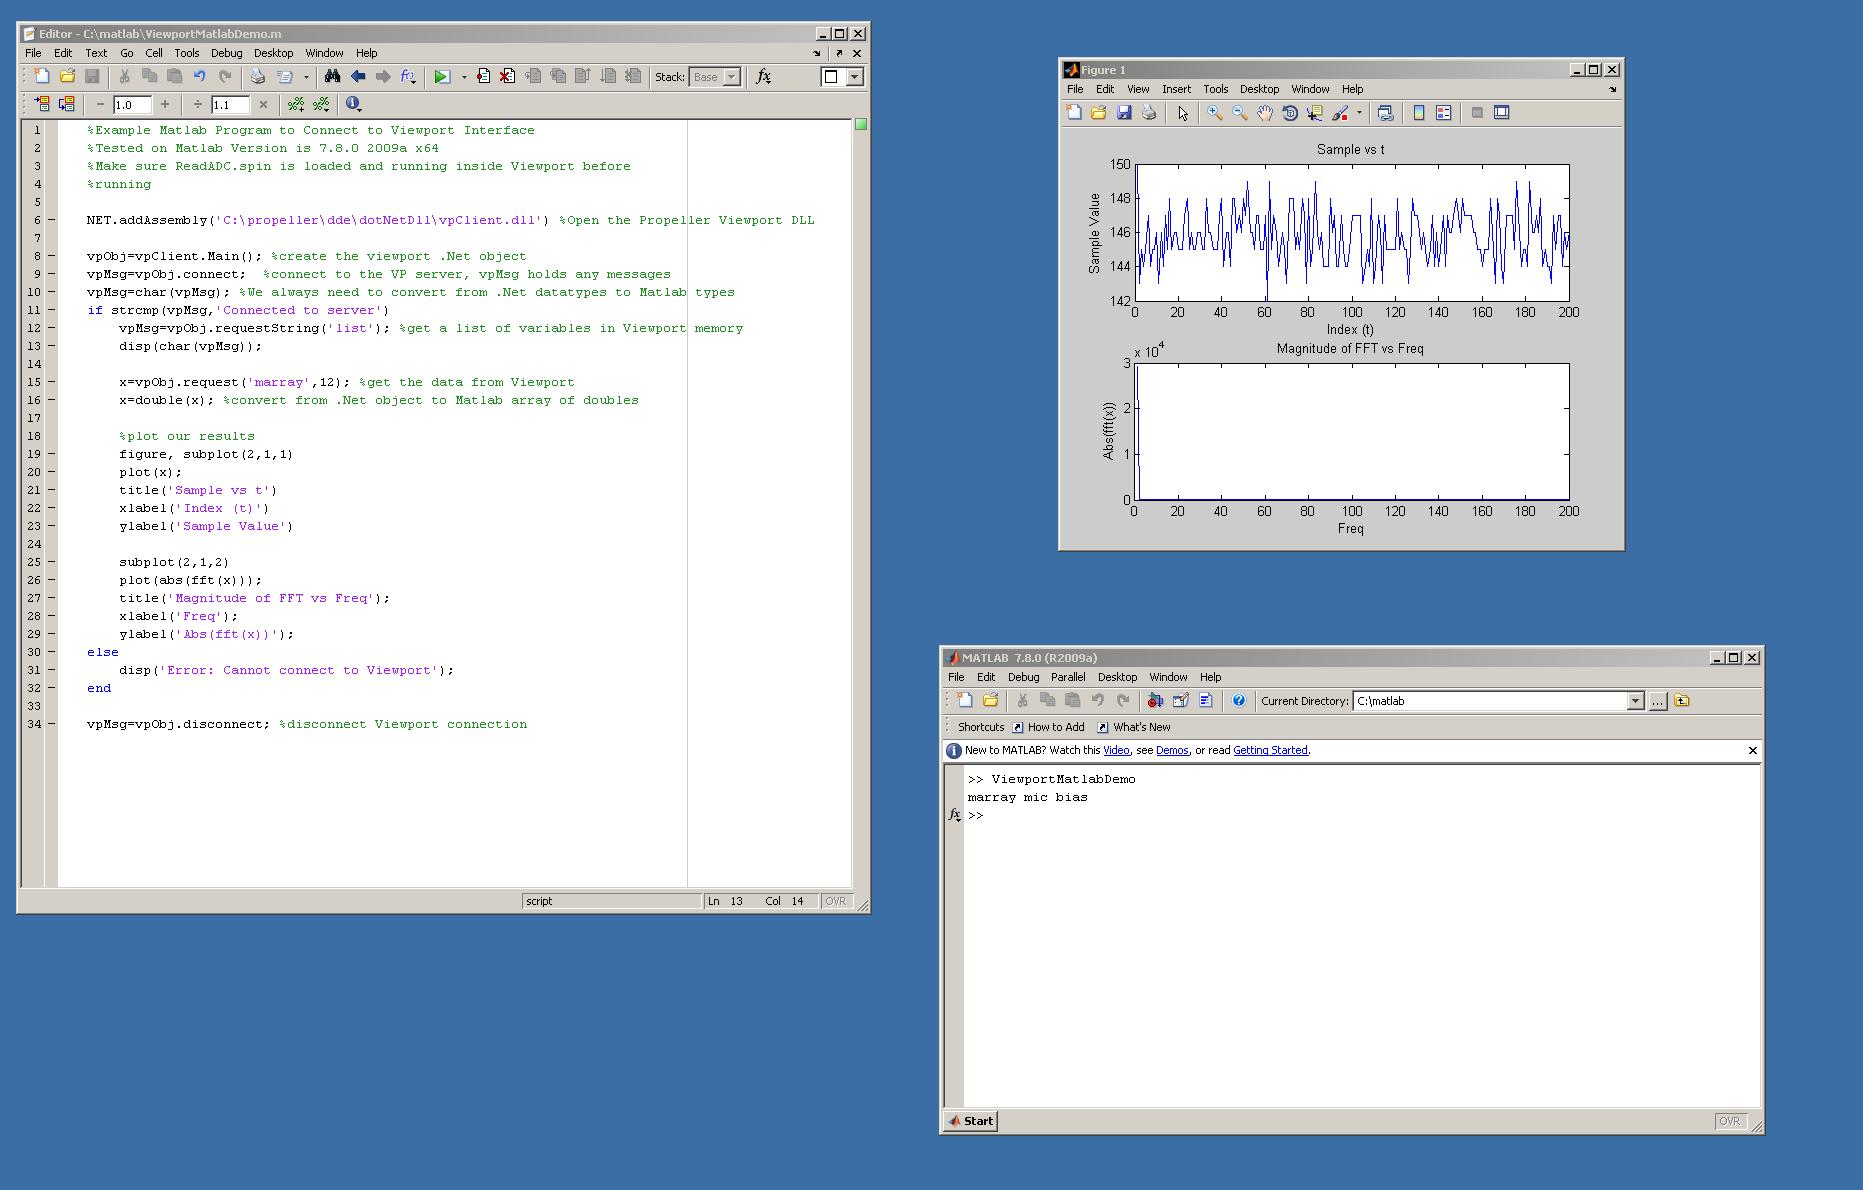
Henry's MATLAB program graphs the measurements taken from the Demoboard's microphone against time and also displays the fourier analysis.
See attached screenshot, or check out the video and kit with all samples, documentation, and source code to the vpclient.dll at: mydancebot.com/viewport/clients.php
Here's the full MATLAB code:
Hanno
▔▔▔▔▔▔▔▔▔▔▔▔▔▔▔▔▔▔▔▔▔▔▔▔
Download a free trial of ViewPort- the premier visual debugger for the Propeller
Includes full debugger, simulated instruments, fuzzy logic, and OpenCV for computer vision. Now a Parallax Product!
MATLAB
python
C#
vb.net
Excel
The documentation describes how to use either DDE (built into many Windows applications), or the vpClient.DLL to monitor variable and arrays, change variables, set trigges, load spin files, and more.
Henry's MATLAB program graphs the measurements taken from the Demoboard's microphone against time and also displays the fourier analysis.
See attached screenshot, or check out the video and kit with all samples, documentation, and source code to the vpclient.dll at: mydancebot.com/viewport/clients.php
Here's the full MATLAB code:
NET.addAssembly('C:\propeller\dde\dotNetDll\vpClient.dll') %Open the Propeller Viewport DLL

vpObj=vpClient.Main(); %create the viewport .Net object
vpMsg=vpObj.connect;  %connect to the VP server, vpMsg holds any messages
vpMsg=char(vpMsg); %We always need to convert from .Net datatypes to Matlab types
x=vpObj.request('marray',12); %get the data from Viewport
x=double(x); %convert from .Net object to Matlab array of doubles

%plot our results
figure, subplot(2,1,1)
plot(x);
title('Sample vs t')
xlabel('Index (t)')
ylabel('Sample Value')

subplot(2,1,2)
plot(abs(fft(x)));
title('Magnitude of FFT vs Freq');
xlabel('Freq');
ylabel('Abs(fft(x))');
Hanno
▔▔▔▔▔▔▔▔▔▔▔▔▔▔▔▔▔▔▔▔▔▔▔▔
Download a free trial of ViewPort- the premier visual debugger for the Propeller
Includes full debugger, simulated instruments, fuzzy logic, and OpenCV for computer vision. Now a Parallax Product!


Comments
▔▔▔▔▔▔▔▔▔▔▔▔▔▔▔▔▔▔▔▔▔▔▔▔
JMH