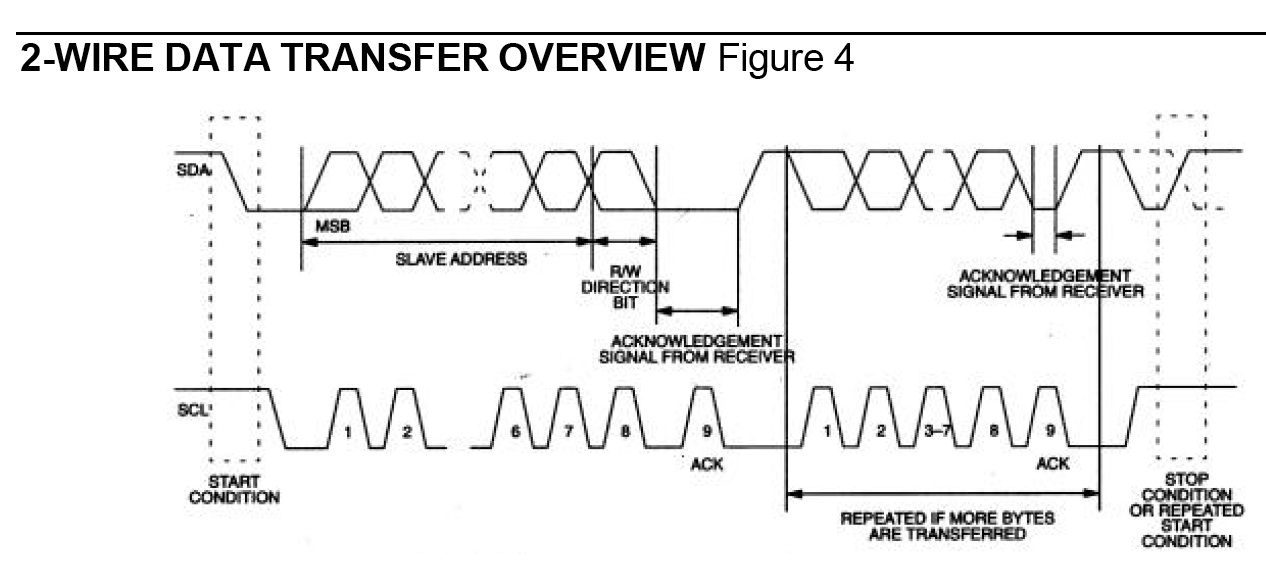
A simple(?) question about a funky waveform on a data sheet
Hi all,
I'm not a EE so I'm sure this question will seem moronic to most of you. I keep seeing this kind of waveform/clocking diagram on data sheets but I don't understand what it's telling me. I understand signals and waveforms, but what's this double up-and-down figure supposed to represent???
thanks a heap,
Mark


Comments
I think it's simply to denote that the wave could be either a 1 or a 0. I had the same question a few years ago:
http://forums.parallax.com/forums/default.aspx?f=25&m=136802
-Parsko
cheers,
Mark
Leon
▔▔▔▔▔▔▔▔▔▔▔▔▔▔▔▔▔▔▔▔▔▔▔▔
Amateur radio callsign: G1HSM
Suzuki SV1000S motorcycle
▔▔▔▔▔▔▔▔▔▔▔▔▔▔▔▔▔▔▔▔▔▔▔▔
Paul Baker
Propeller Applications Engineer
Parallax, Inc.
thanks for filling me in on this.
cheers,
Mark