Use plain -g rather than -gbrk to allow printf() to coexist. Although that might not suit your situation either since I think then the debug() statements simply get converted to printf()'s.
@evanh said:
Use plain -g rather than -gbrk to allow printf() to coexist. Although that might not suit your situation either since I think then the debug() statements simply get converted to printf()'s.
When I do that I don't see any debug output, but the normal printfs in my application are printed...that's as if no debug is happening at all.
❯ loadp2 -t -b 230400 bigdemo.binary
( Entering terminal mode.  Press Ctrl-] or Ctrl-Z to exit. )
Demo starting
Main() is calling intfunc1 with value 1
    ----------
    intfunt1 called, with argument 1
    Adding 200
    Calling external function extfunc1(201)
    Function returned 96652, now returning this value
    ----------
Value returned to main is 96652
Main() is calling intfunc1 with value 96652
    ----------
    intfunt1 called, with argument 96652
    Adding 200
    Calling external function extfunc1(96852)
    Function returned 96652, now returning this value
    ----------
Going back to -gbrk usage, I did another experiment and tried patching the intermediate p2asm COG code before final assembly with a DEBUG statement and that seemed to actually work.
This resulted in correct startup output with the DEBUG output also included. It's as if DEBUG doesn't work when inserted into LUTRAM for some reason but does in COGRAM. Am still investigating....
❯ loadp2 -b 230400 -t bigdemo.binary
( Entering terminal mode. Press Ctrl-] or Ctrl-Z to exit. )
Cog0 INIT $0000_0000 $0000_0000 load
Cog0 INIT $0000_0404 $0000_0000 load
Cog0 hello
Demo starting
Main() is calling intfunc1 with value 1
----------
intfunt1 called, with argument 1
Adding 200
Calling external function extfunc1(201)
***********
Update:
Okay I have discovered more by isolating the code piece by piece:
I can manually add a DEBUG instruction in the patched p2asm in COGRAM and get it to output. I can also jump to some fake LUT code which has a DEBUG statement inside it and get that to output strings also. For some reason in the full version of what I want to do I must have some sort of startup bug that messes with the serial port when debug is enabled (or perhaps is crashing/resetting the P2 resulting in trash being output). So with that method proven I think I can iteratively introduce more of what I do to the code to find which exact part is failing and why. Then I can move on to actually debug what I wanted to in the first place. LOL. Part of what I do is mess with the final binary image and that step could well be upsetting the debugger if some addresses or file lengths it uses are changing.
@rogloh I wouldn't automatically assume it's a serial bug. It also could be debug data corrupted or missing. If you're compiling code with DEBUG statements and then later re-compiling it (or moving it around) then it's quite possible that the debugger is very confused. I think there are a number of assumptions about memory layout embedded in the -gbrk code, and if these are changed or not satisfied then it may be reading the debug strings from the wrong place in memory.
@ersmith said:
@rogloh I wouldn't automatically assume it's a serial bug. It also could be debug data corrupted or missing. If you're compiling code with DEBUG statements and then later re-compiling it (or moving it around) then it's quite possible that the debugger is very confused. I think there are a number of assumptions about memory layout embedded in the -gbrk code, and if these are changed or not satisfied then it may be reading the debug strings from the wrong place in memory.
Yes I am starting to think something like that might be the case. With -grk debug enabled I found if I ORGH a section at $100000 (1MB) then trim the downloaded binary image file off at (say) the 256kB point (the app size is only something around 100kB), it crashes/locks up immediately after the first DEBUG LOAD statement ges printed, but if instead I put my high memory ORGH code down at 400kB and do the same trim at 256kB it's fine. Very strange. Now in theory that may have something to do with my own external memory code trying to bring in and execute this code (as I'm simulating reading external high memory code from HUBRAM right now to simplify things) but it doesn't even seem to reach my cache handler stuff in the first place when it fails. No DEBUG seemed to work in the COG startup code before #_main or my extensions are even called. Although I'm still checking that out today trying to pinpoint the lockup. I did try to flip an IO pin LED at startup and think I saw it light before it went out, which may indicate a reboot, but really need to reconfirm that.
When I trimmed the binary file before downloading, I did confirm it has all zeroes above the trim point so no debug strings should be placed there. They seemed to be somewhere down at $b99 offset in the file.
Program is assembled as normal, but DEBUG statements are converted into BRK #N (with N increasing each time). Associated debugger bytecode is generated and stowed away
Debugger program and bytecodes are combined and pre-pended to the program
When running, the debugger's init code is loaded into cog 0. This will
Setup clock mode and serial pins
Clear high hub RAM at $FC000..$FFFFF
Copy the debugger stuff into there
Enable debugger memory protection
Copy down the normal code to start at address 0
Clear any remaining RAM
Re-launch cog 0 (as the ROM bootloader would've)
The address boundary for the copy/clear operations are defined by patching (by way of hardcoded offset >.> ) the _appsize_ variable in the debugger code.
(EDIT: For completeness, note that executable compression works very similarly - if you have both debugging + compression enabled, compression is applied after the debugger is added. This double serving of init stubs somehow works.)
@Wuerfel_21 said:
Debugger works roughly like this:
Program is assembled as normal, but DEBUG statements are converted into BRK #N (with N increasing each time). Associated debugger bytecode is generated and stowed away
Debugger program and bytecodes are combined and pre-pended to the program
Yes that would explain why I don't see anything debug related at the end of the program.
When running, the debugger's init code is loaded into cog 0. This will
Setup clock mode and serial pins
Clear high hub RAM at $FC000..$FFFFF
Copy the debugger stuff into there
Enable debugger memory protection
Copy down the normal code to start at address 0
Clear any remaining RAM
Re-launch cog 0 (as the ROM bootloader would've)
All makes logical sense.
The address boundary for the copy/clear operations are defined by patching (by way of hardcoded offset >.> ) the _appsize_ variable in the debugger code.
I'll need to examine this, it might be related to my problem if the copy amount is somehow messed up by my ORGH $100000. Hopefully I can overcome it if this is the issue.
EDIT: Ok looks like I might have to patch this value at $e4. I do see it being setup as over 1MB when I do my ORGH. I may have to patch it with something under 512kB where the last non-zero long occurs and also accounting for the debug prepend amount of $C70. Gonna give it a try to see if the lockup disappears.
UPDATE: YES! that was it and after patching the value the debugger hang is fixed. I can make some progress now. Thanks @Wuerfel_21 for this information!
(EDIT: For completeness, note that executable compression works very similarly - if you have both debugging + compression enabled, compression is applied after the debugger is added. This double serving of init stubs somehow works.)
Yeah didn't look into compression issues, that would probably affect things also but have other things to worry about first.
As a last step I split the final binary generated by flexspin which is over 1MB when my external memory code segment is created at $100000. Ultimately I will split the file at an offset of 512kB (or the last non-zero long in the file below this), and anything over 1MB is extracted to a secondary image file although I've noticed the presence of debugger code will push this up a bit higher than 1MB offset in the binary image and I'll probably need to somehow compensate for that too. This secondary upper memory image file will ultimately need to be written to the 1MB boundary in Flash to be read in by my external memory initialization code to PSRAM for example. Then the cache handling code will dynamically bring the external memory code blocks into cache rows on demand.
Tell you what. Running relocated C code from flexspin in hubexec at different cache addresses to the listing file is a real mind-bender to try to debug. Without using P2 DEBUG there'd really be no chance to solve the issues without going insane. So far I found a couple of addressing bugs in my code and fixed them, so some major program hangs I encountered are now fixed and the test code runs a lot further now. But there are still remaining issue(s) to resolve before this is 100% right. Once an AUGD is missed prior to my callpa ##ADDR, farcall_ext2int far calls all hell breaks loose and lockups typically prevail as is expected. All address calculations need to be spot on dealing with the AUGD/AUGS instructions at the wrap boundaries. Am slowly getting there but it's the type of work that needs a fresh brain to work through.
I got further with this and can make a test program using "external" memory code run to completion with the external memory only simulated for now to eliminate any potential external RAM issues (I simply copy some HUB contents from a different location representing bringing data in from PSRAM, HyperRAM etc to the cache). So timing isn't precise but I'm not worried about that right now, just need something to get the code working.
I found an issue with my earlier optimization that moves a JMP #/hubaddr instruction to replace the CALLD flags, wrap_handler placed at the end of each cache row once both sequential rows are in the cache. I thought a simple jump would be okay but unfortunately it doesn't update my current block # and current cache row address when it transitions between cached rows. So instead of a single jump I'll have have it do 2-3 more instructions to jump the row and also update this state. It will still be faster than doing the full cache lookup which adds another read from HUB. For now I disabled this optimization and the code runs to the end without a lockup now. With it fully fitting in the cache it's running about 2x slower than regular hubexec when run normally from HUB but I've not tried to emulate any actual PSRAM read transfer timing, it's just doing a simple RDLONG, WRLONG, ADD RDPTR, #1, ADD WRPTR, #1 type of REP loop to relocate the block's data to cache in hub RAM, which takes anywhere from 9+3+2+2=16 clocks to 16+11+2+2=31 clocks per long. So 16 bit wide PSRAM reading is actually quite a bit faster to transfer to HUB with each long only taking 4 P2 clocks, but will have that extra latency as well. In any case its the first data point I have.
EDIT: actually the "2x slower" is a bit hard to quantify, as it brings in code once to the cache which is slow and then reuses it in a loop which is faster. If I extend the loop count to large numbers I can probably start to approach the full speed of the P2. So the loop count affects this number. If it loops once it'll look really bad too. Also with lots of printf's in the code it made the test code significantly IO bound which made the comparison show almost the same execution times, until I removed all that and retested with pure compute only code.
I was able to tweak the cache row wrap handling code to allow for a much faster boundary wrap situation when the next target block is brought into the cache so it can perform the necessary updates to the block and current cache row address. To do this I had to add 3 more longs per cache row after the CALLD instruction that handles regular wraps. A cached block that wraps will begin looking like this before we know the target address in HUB RAM :
' cached block holding 64..67 instructions executed here (including any AUGS/AUGD/SETQ around wrap point of block)
CALLD flags, wrap_handler ' do a wrap
after the next cache row is brought in the wrapping row's trailing instructions will be patched (via block move) to do this:
' cached block holding 64..67 instructions executed here
JMP #\fast_wrap
long 0 ' unused
long pa ' holds activerow plus offset that skips the AUGS/AUGD/SETQ at the start of the block which have already been executed at the end of this block
long activerow
fast_wrap
add block, #1 ' increment block
rflong pa ' read from fifo jump address including offset
rflong activerow ' read next active row base address
jmp pa ' branch directly to next block in cache after any AUGD/AUGS/SETQ offset etc
I do know of another method which can run even faster but the instructions are harder to construct on the fly due to containing 20 bit address parameters and will slow down the cache misses vs simpler moves. That would be where this handler is executed in-place directly using HUB-EXEC code placed at the end of each cached block. This variant would save 4 clocks over the above so I may still consider doing this anyway - it also adds more COGRAM template constants...TBD. EDIT: actually a simple logical OR could be useful here for including the instruction's address bits. Though I'd still need to reload the template components.
' cached block holding 64..67 instructions executed here
add block, #1 ' increment block
loc pa, #nnnn ' read active row address
mov activerow, pa ' setup next active row base address
jmp #aaaaaaaa ' branch directly to next block in cache after any AUGD/AUGS/SETQ offset etc
Downside of both schemes is that it consumes 12 more bytes per row (up to 3kB for a 256 row cache). But it can save a total 27..34 cycles per row wrap once cached which is significant inside a loop for example.
Update: this new approach (first one above) seems to be working with the code now and solved the issue I encountered previously. I'll also look into the second one to see how much of an impact it has.
Hi @ersmith I'm having a problem with flexspin in my testing. For some reason I can't seem to disable the use of FCACHE with the attributes assigned to my functions placed in high memory. I tried both !fcache and no-fcache forms in the attribute list and both continue to generate FCACHE code which breaks my external memory operation if it straddles two blocks. Is there a good way to disable FCACHE fully?
The 4-bit SD card driver depends on Fcache functioning. Make sure you're not using that driver when you do this.
EDIT: Err, it is no issue at all. It still works without the optimiser using Fcache.
@rogloh Yeah, unfortunately FCACHE is all or nothing. For now you'll want to disable it globally. I can't remember right now why it's a global pass, but there was a reason -- I think something to do with inlining recursive functions.
@Wuerfel_21 said:
For some reason FCACHE optimization is a global pass, so you can only disable it on the command line
@ersmith said:
@rogloh Yeah, unfortunately FCACHE is all or nothing. For now you'll want to disable it globally. I can't remember right now why it's a global pass, but there was a reason -- I think something to do with inlining recursive functions.
Okay thanks. I will disable it globally. That will slow down the internal functions too which is a pity.
Right now I'm porting the CoreMark benchmark and trying to run that to give us another datapoint in terms of performance. I guess I can compare internal hubexec operation without FCACHE to "external" hubexec without FCACHE.
By the way, it may still be possible to support FCACHE sometime down the track with this external memory scheme. Would just need to alter the FCACHE handler to a special one that checks if the COGRAM executable block is being read from internal/external addresses (ie. whether sourced from the I-cache or not) and make it also deal with wrapping over cache row boundaries if that ever happens. Bit too complex to add to this version right now but I do expect it's potentially also achievable sometime.
This would presume that the FCACHED COGRAM code itself does not call back out to other external functions which is probably a step too far given it opens up the possibility of unsupported re-entrancy issues anyway.
@evanh said:
The 4-bit SD card driver depends on Fcache functioning. Make sure you're not using that driver when you do this.
Ok. Good to know. Thanks evanh.
Err, I just bothered to test this. Compile option -Ono-fcache, and -O0, still works fine with the 4-bit SD card driver. So I guess I made a bad assumption as in I thought Fcache would be disabled. But since the driver uses volatile with each critical Pasm section that needs Fcache it still gets to use Fcache irrespective of what the optimiser is told to do.
I suppose that's still a not good case for you though, since you don't want anything using Fcache.
Does anyone know if Chip's runtime debugger standalone program works with flexspin debugging output? And if so, can it be made to work with MacOS Ventura?
I'm having a hard time tracking down what looks like some sort of stack corruption bug and using a decent debugger that I can step through blocks of code and examining memory would be very handy right now. I tried running Stephen Moraco's Pnut-Term-TS which looked good hoping that would help but found it doesn't yet support the run time debugger feature.
Wading through hundreds of output lines of hex numbers and stack frame data values is not exactly fun trying to locate when this potential corruption occurs and it's becoming tedious. Also to make it harder this problem has the tendency to morph when the code is changed trying to add debug statements to find it (Heisenbug).
@evanh said:
Where is this standalone debugger program hidden?
I mean the PNut debugger tool Chip wrote where you could examine COG/HUB contents and step through/trace code etc. I'm not sure what it is actually named or it if is already built into his own tools etc as I don't have a PC to use them. P2 documentation mentions it fires up when the DEBUG command is inserted in the code without parenthesis.
I think that the debugger is built into PNut, hence not really "stand alone", so alas it won't work with FlexProp. That's as far as I know, I could be wrong.
@ersmith said:
I think that the debugger is built into PNut, hence not really "stand alone", so alas it won't work with FlexProp. That's as far as I know, I could be wrong.
Oh, I was sort of hoping the underlying debug mechanism would carry the information needed for presenting the state. But if it's a slightly different port between flexspin and PropTool/PNut that might prevent that from happening... Maybe @Wuerfel_21 has some insights there. It makes sense that there couldn't be source file integration in that case, but I was hoping it might still present data as shown above and let us setup break's and/or single step the code. General stuff that wouldn't need to know the actual executable format or SPIN bytecodes etc.
Okay, Eric's comment prompted me to look at what Pnut can do ... I found an option I hadn't noticed before: -debug. It provides debugging mode without any file downloading. So that's as good as stand-alone really .... huh, and the feature has existed since early 2021.
Generally step debugger should work, as far as the P2 side is concerned. Getting the PC side to sync up to it, idk, don't think I ever got it to work (for lack of trying, tbf).
Note that I think flexspin's debugger code might be a couple versions behind PNut? The last time I merged in new changes was a long while ago. Not sure if there's any incompatible protocol versions.
Thankfully I finally just found and fixed the bug in my code that was trashing memory and holding me up. One missed subtraction instruction where it was required. Now I can run the partially ported CoreMark benchmark code. NOTE: only 1 of the 3 benchmark tests included are currently running from simulated external memory, i.e. the linked list processing code. But the main thing is that it is actually now running! With this issue handled, I should now be able to port the other two benchmark routines (matrix multiplication & CRC handling, and state machine processing) and also make it run from real external RAM.
All of it easily fits in the 64kB I-cache so it runs pretty fast given there are 300 iterations of the test. I'd try less but it needs at least 10 second runs for its performance numbers.
The test results below had simulated external memory block transfers with this simple 16..30 clock cycle per long transfer loop which is actually going to be much slower that PSRAM DMA via the streamer, even after accounting for the latency which roughly doubles the total transfer time based on 256 byte blocks (yielding around one long per 8 P2 clocks for 16 bit PSRAM).
blkcopy
DEBUG("loadrow: copying from ",UHEX_LONG_(extaddr), " to ", UHEX_LONG_(hubaddr))
rep #4,#68
rdlong offset,extaddr
wrlong offset,hubaddr
add extaddr,#4
add hubaddr,#4
ret
**External memory run: **
2K performance run parameters for coremark.
CoreMark Size : 666
Total ticks : 3154435176
Total time (secs): 19 <------ only about one second slower
Iterations/Sec : 15
Iterations : 300
Compiler version : Please put compiler version here (e.g. gcc 4.1)
Compiler flags : -Os
Memory location : STACK
seedcrc : 0xe9f5
[0]crclist : 0xe714
[0]crcmatrix : 0x1fd7
[0]crcstate : 0x8e3a
[0]crcfinal : 0x5275
Correct operation validated. See README.md for run and reporting rules.
**Internal memory run: **
2K performance run parameters for coremark.
CoreMark Size : 666
Total ticks : 2994005640
Total time (secs): 18
Iterations/Sec : 16
Iterations : 300
Compiler version : Please put compiler version here (e.g. gcc 4.1)
Compiler flags : -Os
Memory location : STACK
seedcrc : 0xe9f5
[0]crclist : 0xe714
[0]crcmatrix : 0x1fd7
[0]crcstate : 0x8e3a
[0]crcfinal : 0x5275
Correct operation validated. See README.md for run and reporting rules.
Both runs used -O0 optimization level for fairness in the comparison. This was mainly just done for FCache disabling but in time I can try putting some of the safe optimizations back.
Update: with the default optimizations enabled (no -O specified) and running internally from HUB RAM it ran quite a bit faster so we'll certainly want to put some back. This is with the P2 at 160MHz. So its CoreMark score is 30 for 160MHz. Not that good actually compared to other 32 bit microcontrollers which get around 1-3 CoreMark per MHz (although they have faster RAMs and caches). Probably this is as a result of all the hub RAM reads/writes and branches slowing down hubexec operation quite a bit. Can't be helped on the P2 really. But the good thing is that it probably lessens the impact of running I-cached from external memory as it's already been bogged down anyway and the additional branch/call overhead isn't going to add that much more of a penalty. So I suspect there'll be less of an downside to run from external memory in cases of large applications that can really benefit with the extra code space. MicroPython would be a good example of this, but that application still can't be compiled with Flexspin unfortunately (AFAIK).
Ugh, so my automatic search for illegal instructions just found that flexspin uses JMPREL for switch/case statements in C to branch to a jump table (even with optimization level 0) and this can crash the CoreMark benchmark program. In this case JMPREL can't be used in external memory blocks as it might well cross a row boundary in the cache.
./genext extmem.p2asm
Separating low and high memory functions
Transforming branches and calls
Searching for unsupported instructions in high memory
JMPREL instruction use is not allowed in external memory functions
First found in external memory segment on line 2318
Code follows:
2313- mov _var02, _var08
2314- mov _var14, _var02
2315- signx _var14, #15
2316- and _var14, #7
2317- fle _var14, #8
2318: jmprel _var14
2319-LR__0455
2320- callpa ##LR__0456, farjmp_handler
2321- callpa ##LR__0457, farjmp_handler
2322- callpa ##LR__0458, farjmp_handler
2323- callpa ##LR__0459, farjmp_handler
Thankfully I was able to patch the offending JMPREL {#/##}xx instructions with this small group instead
which then seems to branch into the table at the correct location. It needs to multiply by 8 instead of 4 because these branches in high memory now all use ## prefixes (I hope..?). Also I don't expect to see conditional flags on the JMPREL as the fall through is the first case statement jump target.
I should be able to update my SED scripts to do this automatically and allow the JMPREL.
Once I did this I could run all three of the benchmark tests. I had to drop the iterations down to not wrap the 32 bit P2 timer (26 seconds at 160MHz) so the test wouldn't fail. Running all 3 tests from simulated external RAM achieved 11 iterations/second. This compares to 16 per second for regular HUB exec. So for this benchmark we are running at ~69% of HUB exec speed (optimizations disabled) when we run from I-cache and that is when we are transferring blocks slower that regular PSRAM will be. This includes all call & branch overheads and row wrapping. Not too bad.
**External memory run: (200 iterations) **
2K performance run parameters for coremark.
CoreMark Size : 666
Total ticks : 2973148880
Total time (secs): 18
Iterations/Sec : 11
Iterations : 200
Compiler version : Please put compiler version here (e.g. gcc 4.1)
Compiler flags : -Os
Memory location : STACK
seedcrc : 0xe9f5
[0]crclist : 0xe714
[0]crcmatrix : 0x1fd7
[0]crcstate : 0x8e3a
[0]crcfinal : 0x382f
Correct operation validated. See README.md for run and reporting rules.
For reference the size of the external memory segment used by the CoreMark application is only ~11kB (44x256 byte blocks) so it easily fits the cache and no row replacement is happening. I could maybe drop my cache row count and see it thrash.
@Wuerfel_21 said:
If you're compiling at -O0 without the basic move elimination stuff, your code is probably significantly larger than it should be, anyways.
Yep. I'm going to start adding back the safer optimizations, to see what the results are and will update this post. The default optimizations almost doubled performance in the internal memory tests above (ie. regular hubexec operation).
UPDATE: results for enabling optimizations according to using -O0,inline-small,regs,const,special-functions,peephole
Looks like it went from 11 to 18 iterations per second - big performance improvement. Now we running at about 18/30 of optimized internal RAM code (minus Fcache) or ~60%. So this is still reasonable. My assumption from the prior work a few years back was a bit under half of native speed but it is obviously highly dependent on the code itself as well as the size of its working set, plus I still have to get it working with real PSRAM which might assist it further. I should look at that next.
2K performance run parameters for coremark.
CoreMark Size : 666
Total ticks : 1868098736
Total time (secs): 11
Iterations/Sec : 18
Iterations : 200
...
ps. code size went down from 11k to 7800 bytes after optimizations were added back in.
Running all 3 tests from simulated external RAM achieved 11 iterations/second. This compares to 16 per second for regular HUB exec.
That's impressive. Catalina does about 17 per iterations per second for coremark using Hub Exec. But that's at 180Mhz. Why do you use 160Mhz? Is it something to do with your external RAM hardware?
EDIT: Of course, the good thing about coremark (over dhrystone etc) is that it has built-in support for multi-processing. Catalina gets a coremark score of 82 using 5 cogs. Will your new hardware support multi-processing? Catalina's current XMM RAM implementtaion cannot, which is why I generally have to use both NATIVE and XMM modes at the same time (e.g. with Lua). It would be great not to have to do that.
Running all 3 tests from simulated external RAM achieved 11 iterations/second. This compares to 16 per second for regular HUB exec.
That's impressive. Catalina does about 17 per iterations per second for coremark using Hub Exec. But that's at 180Mhz. Why do you use 160Mhz? Is it something to do with your external RAM hardware?
160MHz is just the default for flexspin C . We could choose anything below maybe ~340MHz if the HW supports that rate. Also note that 11 iterations per second was obtained with all default optimizations disabled. Once I enabled them again (except for Fcache) it boosted up to 18 per second at 160MHz.
EDIT: Of course, the good thing about coremark (over dhrystone etc) is that it has built-in support for multi-processing. Catalina gets a coremark score of 82 using 5 cogs. Will your new hardware support multi-processing? Catalina's current XMM RAM implementtaion cannot, which is why I generally have to use both NATIVE and XMM modes at the same time (e.g. with Lua). It would be great not to have to do that.
Haven't considered it yet but in theory multiple COGs running from external memory could each have their own I-caches and share a common external memory, with a commensurate reduction in performance. The main limitation here is that this model doesn't keep directly accessed data in the external RAM, just code, although bulk data could be stored there and indirectly accessed through R/W transfer APIs. I imagine its just a bit too much of a performance hit due to latency and also requires more extensive compiler support to try to store data in external memory. What I've done in my scripts (mainly performing FAR calls and branches in a certain way defined earlier for external memory segments) is about the bare minimum to get it running and would hopefully not be difficult to integrate with the flexspin compiler.


Comments
Use plain
-grather than-gbrkto allow printf() to coexist. Although that might not suit your situation either since I think then the debug() statements simply get converted to printf()'s.When I do that I don't see any debug output, but the normal printfs in my application are printed...that's as if no debug is happening at all.
❯ loadp2 -t -b 230400 bigdemo.binary ( Entering terminal mode. Press Ctrl-] or Ctrl-Z to exit. ) Demo starting Main() is calling intfunc1 with value 1 ---------- intfunt1 called, with argument 1 Adding 200 Calling external function extfunc1(201) Function returned 96652, now returning this value ---------- Value returned to main is 96652 Main() is calling intfunc1 with value 96652 ---------- intfunt1 called, with argument 96652 Adding 200 Calling external function extfunc1(96852) Function returned 96652, now returning this value ----------Going back to -gbrk usage, I did another experiment and tried patching the intermediate p2asm COG code before final assembly with a DEBUG statement and that seemed to actually work.
 skip_clock_set_
    mov pa, ##@lutentry
    setq2   #255
    rdlong  16, pa
    DEBUG("hello")
    call    #_main
cogexit
    waitx   ##160000
This resulted in correct startup output with the DEBUG output also included. It's as if DEBUG doesn't work when inserted into LUTRAM for some reason but does in COGRAM. Am still investigating....
❯ loadp2 -b 230400 -t bigdemo.binary
( Entering terminal mode.  Press Ctrl-] or Ctrl-Z to exit. )
Cog0  INIT $0000_0000 $0000_0000 load
Cog0  INIT $0000_0404 $0000_0000 load
Cog0  hello
Demo starting
Main() is calling intfunc1 with value 1
    ----------
    intfunt1 called, with argument 1
    Adding 200
    Calling external function extfunc1(201)
        ***********
Update:
Okay I have discovered more by isolating the code piece by piece:
I can manually add a DEBUG instruction in the patched p2asm in COGRAM and get it to output. I can also jump to some fake LUT code which has a DEBUG statement inside it and get that to output strings also. For some reason in the full version of what I want to do I must have some sort of startup bug that messes with the serial port when debug is enabled (or perhaps is crashing/resetting the P2 resulting in trash being output). So with that method proven I think I can iteratively introduce more of what I do to the code to find which exact part is failing and why. Then I can move on to actually debug what I wanted to in the first place. LOL. Part of what I do is mess with the final binary image and that step could well be upsetting the debugger if some addresses or file lengths it uses are changing.
@rogloh I wouldn't automatically assume it's a serial bug. It also could be debug data corrupted or missing. If you're compiling code with DEBUG statements and then later re-compiling it (or moving it around) then it's quite possible that the debugger is very confused. I think there are a number of assumptions about memory layout embedded in the
-gbrkcode, and if these are changed or not satisfied then it may be reading the debug strings from the wrong place in memory.Yes I am starting to think something like that might be the case. With -grk debug enabled I found if I ORGH a section at $100000 (1MB) then trim the downloaded binary image file off at (say) the 256kB point (the app size is only something around 100kB), it crashes/locks up immediately after the first DEBUG LOAD statement ges printed, but if instead I put my high memory ORGH code down at 400kB and do the same trim at 256kB it's fine. Very strange. Now in theory that may have something to do with my own external memory code trying to bring in and execute this code (as I'm simulating reading external high memory code from HUBRAM right now to simplify things) but it doesn't even seem to reach my cache handler stuff in the first place when it fails. No DEBUG seemed to work in the COG startup code before #_main or my extensions are even called. Although I'm still checking that out today trying to pinpoint the lockup. I did try to flip an IO pin LED at startup and think I saw it light before it went out, which may indicate a reboot, but really need to reconfirm that.
When I trimmed the binary file before downloading, I did confirm it has all zeroes above the trim point so no debug strings should be placed there. They seemed to be somewhere down at $b99 offset in the file.
Debugger works roughly like this:
The address boundary for the copy/clear operations are defined by patching (by way of hardcoded offset >.> ) the
_appsize_variable in the debugger code.(EDIT: For completeness, note that executable compression works very similarly - if you have both debugging + compression enabled, compression is applied after the debugger is added. This double serving of init stubs somehow works.)
Yes that would explain why I don't see anything debug related at the end of the program.
All makes logical sense.
I'll need to examine this, it might be related to my problem if the copy amount is somehow messed up by my ORGH $100000. Hopefully I can overcome it if this is the issue.")
EDIT: Ok looks like I might have to patch this value at $e4. I do see it being setup as over 1MB when I do my ORGH. I may have to patch it with something under 512kB where the last non-zero long occurs and also accounting for the debug prepend amount of $C70. Gonna give it a try to see if the lockup disappears.
UPDATE: YES! that was it and after patching the value the debugger hang is fixed. I can make some progress now. Thanks @Wuerfel_21 for this information!
Yeah didn't look into compression issues, that would probably affect things also but have other things to worry about first.
As a last step I split the final binary generated by flexspin which is over 1MB when my external memory code segment is created at $100000. Ultimately I will split the file at an offset of 512kB (or the last non-zero long in the file below this), and anything over 1MB is extracted to a secondary image file although I've noticed the presence of debugger code will push this up a bit higher than 1MB offset in the binary image and I'll probably need to somehow compensate for that too. This secondary upper memory image file will ultimately need to be written to the 1MB boundary in Flash to be read in by my external memory initialization code to PSRAM for example. Then the cache handling code will dynamically bring the external memory code blocks into cache rows on demand.
Tell you what. Running relocated C code from flexspin in hubexec at different cache addresses to the listing file is a real mind-bender to try to debug. Without using P2 DEBUG there'd really be no chance to solve the issues without going insane. So far I found a couple of addressing bugs in my code and fixed them, so some major program hangs I encountered are now fixed and the test code runs a lot further now. But there are still remaining issue(s) to resolve before this is 100% right. Once an AUGD is missed prior to my callpa ##ADDR, farcall_ext2int far calls all hell breaks loose and lockups typically prevail as is expected. All address calculations need to be spot on dealing with the AUGD/AUGS instructions at the wrap boundaries. Am slowly getting there but it's the type of work that needs a fresh brain to work through.
I got further with this and can make a test program using "external" memory code run to completion with the external memory only simulated for now to eliminate any potential external RAM issues (I simply copy some HUB contents from a different location representing bringing data in from PSRAM, HyperRAM etc to the cache). So timing isn't precise but I'm not worried about that right now, just need something to get the code working.
I found an issue with my earlier optimization that moves a JMP #/hubaddr instruction to replace the CALLD flags, wrap_handler placed at the end of each cache row once both sequential rows are in the cache. I thought a simple jump would be okay but unfortunately it doesn't update my current block # and current cache row address when it transitions between cached rows. So instead of a single jump I'll have have it do 2-3 more instructions to jump the row and also update this state. It will still be faster than doing the full cache lookup which adds another read from HUB. For now I disabled this optimization and the code runs to the end without a lockup now. With it fully fitting in the cache it's running about 2x slower than regular hubexec when run normally from HUB but I've not tried to emulate any actual PSRAM read transfer timing, it's just doing a simple RDLONG, WRLONG, ADD RDPTR, #1, ADD WRPTR, #1 type of REP loop to relocate the block's data to cache in hub RAM, which takes anywhere from 9+3+2+2=16 clocks to 16+11+2+2=31 clocks per long. So 16 bit wide PSRAM reading is actually quite a bit faster to transfer to HUB with each long only taking 4 P2 clocks, but will have that extra latency as well. In any case its the first data point I have.
EDIT: actually the "2x slower" is a bit hard to quantify, as it brings in code once to the cache which is slow and then reuses it in a loop which is faster. If I extend the loop count to large numbers I can probably start to approach the full speed of the P2. So the loop count affects this number. If it loops once it'll look really bad too. Also with lots of printf's in the code it made the test code significantly IO bound which made the comparison show almost the same execution times, until I removed all that and retested with pure compute only code.
I was able to tweak the cache row wrap handling code to allow for a much faster boundary wrap situation when the next target block is brought into the cache so it can perform the necessary updates to the block and current cache row address. To do this I had to add 3 more longs per cache row after the CALLD instruction that handles regular wraps. A cached block that wraps will begin looking like this before we know the target address in HUB RAM :
after the next cache row is brought in the wrapping row's trailing instructions will be patched (via block move) to do this:
The fast_wrap handler code (stored in LUT) is called which can read the parameter data quickly using the FIFO (using the tricks that @TonyB_ found in this thread https://forums.parallax.com/discussion/177945/rflong-works-in-hub-exec ) :
fast_wrap
                add     block, #1                   ' increment block
                rflong  pa                          ' read from fifo jump address including offset
                rflong  activerow                   ' read next active row base address
                jmp     pa                          ' branch directly to next block in cache after any AUGD/AUGS/SETQ offset etc
I do know of another method which can run even faster but the instructions are harder to construct on the fly due to containing 20 bit address parameters and will slow down the cache misses vs simpler moves. That would be where this handler is executed in-place directly using HUB-EXEC code placed at the end of each cached block. This variant would save 4 clocks over the above so I may still consider doing this anyway - it also adds more COGRAM template constants...TBD. EDIT: actually a simple logical OR could be useful here for including the instruction's address bits. Though I'd still need to reload the template components.
' cached block holding 64..67 instructions executed here
                add     block, #1                   ' increment block
                loc     pa, #nnnn                   ' read active row address
                mov     activerow, pa               ' setup next active row base address
                jmp     #aaaaaaaa                   ' branch directly to next block in cache after any AUGD/AUGS/SETQ offset etc
Downside of both schemes is that it consumes 12 more bytes per row (up to 3kB for a 256 row cache). But it can save a total 27..34 cycles per row wrap once cached which is significant inside a loop for example.
Update: this new approach (first one above) seems to be working with the code now and solved the issue I encountered previously. I'll also look into the second one to see how much of an impact it has.
Hi @ersmith I'm having a problem with flexspin in my testing. For some reason I can't seem to disable the use of FCACHE with the attributes assigned to my functions placed in high memory. I tried both !fcache and no-fcache forms in the attribute list and both continue to generate FCACHE code which breaks my external memory operation if it straddles two blocks. Is there a good way to disable FCACHE fully?
For example this C code:
#define FAR_ATTR __attribute__(opt(0,regs,local-reuse,branch-convert,remove-dead,const,special-functions,!fcache))
#define FAR(x) FAR_##x

list_head *
FAR(core_list_reverse)(list_head *list) FAR_ATTR
{
    list_head *next = NULL, *tmp;
    while (list)
    {
        tmp        = list->next;
        list->next = next;
        next       = list;
        list       = tmp;
    }
    return next;
}
generates this code which still does use the FCACHE for some reason which crashes my benchmarking application:
_FAR_core_list_reverse mov _var01, #0 cmp arg01, #0 wz if_e callpa ##LR__0112, farjmp_handler callpa #(@LR__0111-@LR__0110)>>2,fcache_load_ptr_ LR__0110 rdlong result1, arg01 wrlong _var01, arg01 mov _var01, arg01 mov arg01, result1 wz if_ne callpa ##LR__0110, farjmp_handler LR__0111 LR__0112 mov result1, _var01 _FAR_core_list_reverse_ret retFor some reason FCACHE optimization is a global pass, so you can only disable it on the command line
The 4-bit SD card driver depends on Fcache functioning. Make sure you're not using that driver when you do this.
EDIT: Err, it is no issue at all. It still works without the optimiser using Fcache.
@rogloh Yeah, unfortunately FCACHE is all or nothing. For now you'll want to disable it globally. I can't remember right now why it's a global pass, but there was a reason -- I think something to do with inlining recursive functions.
Okay thanks. I will disable it globally. That will slow down the internal functions too which is a pity.
Right now I'm porting the CoreMark benchmark and trying to run that to give us another datapoint in terms of performance. I guess I can compare internal hubexec operation without FCACHE to "external" hubexec without FCACHE.
Ok. Good to know. Thanks evanh.
By the way, it may still be possible to support FCACHE sometime down the track with this external memory scheme. Would just need to alter the FCACHE handler to a special one that checks if the COGRAM executable block is being read from internal/external addresses (ie. whether sourced from the I-cache or not) and make it also deal with wrapping over cache row boundaries if that ever happens. Bit too complex to add to this version right now but I do expect it's potentially also achievable sometime.
This would presume that the FCACHED COGRAM code itself does not call back out to other external functions which is probably a step too far given it opens up the possibility of unsupported re-entrancy issues anyway.
Err, I just bothered to test this. Compile option
-Ono-fcache, and-O0, still works fine with the 4-bit SD card driver. So I guess I made a bad assumption as in I thought Fcache would be disabled. But since the driver usesvolatilewith each critical Pasm section that needs Fcache it still gets to use Fcache irrespective of what the optimiser is told to do.I suppose that's still a not good case for you though, since you don't want anything using Fcache.
Does anyone know if Chip's runtime debugger standalone program works with flexspin debugging output? And if so, can it be made to work with MacOS Ventura?
I'm having a hard time tracking down what looks like some sort of stack corruption bug and using a decent debugger that I can step through blocks of code and examining memory would be very handy right now. I tried running Stephen Moraco's Pnut-Term-TS which looked good hoping that would help but found it doesn't yet support the run time debugger feature.
Wading through hundreds of output lines of hex numbers and stack frame data values is not exactly fun trying to locate when this potential corruption occurs and it's becoming tedious. Also to make it harder this problem has the tendency to morph when the code is changed trying to add debug statements to find it (Heisenbug).
Where is this standalone debugger program hidden?
I mean the PNut debugger tool Chip wrote where you could examine COG/HUB contents and step through/trace code etc. I'm not sure what it is actually named or it if is already built into his own tools etc as I don't have a PC to use them. P2 documentation mentions it fires up when the DEBUG command is inserted in the code without parenthesis.
EDIT: This tool :
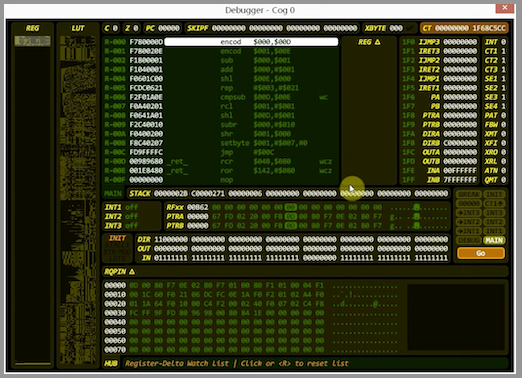
I think that the debugger is built into PNut, hence not really "stand alone", so alas it won't work with FlexProp. That's as far as I know, I could be wrong.
Oh, I was sort of hoping the underlying debug mechanism would carry the information needed for presenting the state. But if it's a slightly different port between flexspin and PropTool/PNut that might prevent that from happening... Maybe @Wuerfel_21 has some insights there. It makes sense that there couldn't be source file integration in that case, but I was hoping it might still present data as shown above and let us setup break's and/or single step the code. General stuff that wouldn't need to know the actual executable format or SPIN bytecodes etc.
Okay, Eric's comment prompted me to look at what Pnut can do ... I found an option I hadn't noticed before:
-debug. It provides debugging mode without any file downloading. So that's as good as stand-alone really .... huh, and the feature has existed since early 2021.Generally step debugger should work, as far as the P2 side is concerned. Getting the PC side to sync up to it, idk, don't think I ever got it to work (for lack of trying, tbf).
Note that I think flexspin's debugger code might be a couple versions behind PNut? The last time I merged in new changes was a long while ago. Not sure if there's any incompatible protocol versions.
Thankfully I finally just found and fixed the bug in my code that was trashing memory and holding me up. One missed subtraction instruction where it was required. Now I can run the partially ported CoreMark benchmark code. NOTE: only 1 of the 3 benchmark tests included are currently running from simulated external memory, i.e. the linked list processing code. But the main thing is that it is actually now running! With this issue handled, I should now be able to port the other two benchmark routines (matrix multiplication & CRC handling, and state machine processing) and also make it run from real external RAM.
All of it easily fits in the 64kB I-cache so it runs pretty fast given there are 300 iterations of the test. I'd try less but it needs at least 10 second runs for its performance numbers.
The test results below had simulated external memory block transfers with this simple 16..30 clock cycle per long transfer loop which is actually going to be much slower that PSRAM DMA via the streamer, even after accounting for the latency which roughly doubles the total transfer time based on 256 byte blocks (yielding around one long per 8 P2 clocks for 16 bit PSRAM).
blkcopy
                DEBUG("loadrow: copying from ",UHEX_LONG_(extaddr), " to ", UHEX_LONG_(hubaddr))
                rep     #4,#68
                rdlong  offset,extaddr
                wrlong  offset,hubaddr
                add     extaddr,#4
                add     hubaddr,#4
                ret
**External memory run: **
**Internal memory run: **
Both runs used -O0 optimization level for fairness in the comparison. This was mainly just done for FCache disabling but in time I can try putting some of the safe optimizations back.
Update: with the default optimizations enabled (no -O specified) and running internally from HUB RAM it ran quite a bit faster so we'll certainly want to put some back. This is with the P2 at 160MHz. So its CoreMark score is 30 for 160MHz. Not that good actually compared to other 32 bit microcontrollers which get around 1-3 CoreMark per MHz (although they have faster RAMs and caches). Probably this is as a result of all the hub RAM reads/writes and branches slowing down hubexec operation quite a bit. Can't be helped on the P2 really. But the good thing is that it probably lessens the impact of running I-cached from external memory as it's already been bogged down anyway and the additional branch/call overhead isn't going to add that much more of a penalty. So I suspect there'll be less of an downside to run from external memory in cases of large applications that can really benefit with the extra code space. MicroPython would be a good example of this, but that application still can't be compiled with Flexspin unfortunately (AFAIK).
**Internal memory run: (default optimizations enabled) **
Ugh, so my automatic search for illegal instructions just found that flexspin uses JMPREL for switch/case statements in C to branch to a jump table (even with optimization level 0) and this can crash the CoreMark benchmark program. In this case JMPREL can't be used in external memory blocks as it might well cross a row boundary in the cache.
Thankfully I was able to patch the offending
JMPREL {#/##}xxinstructions with this small group insteadMOV PA, {#/##}xx SHL PA, #3 ADD PA, ##$+12 CALLPA PA, farjmp_handler2which then seems to branch into the table at the correct location. It needs to multiply by 8 instead of 4 because these branches in high memory now all use ## prefixes (I hope..?). Also I don't expect to see conditional flags on the JMPREL as the fall through is the first case statement jump target.
I should be able to update my SED scripts to do this automatically and allow the JMPREL.
Once I did this I could run all three of the benchmark tests. I had to drop the iterations down to not wrap the 32 bit P2 timer (26 seconds at 160MHz) so the test wouldn't fail. Running all 3 tests from simulated external RAM achieved 11 iterations/second. This compares to 16 per second for regular HUB exec. So for this benchmark we are running at ~69% of HUB exec speed (optimizations disabled) when we run from I-cache and that is when we are transferring blocks slower that regular PSRAM will be. This includes all call & branch overheads and row wrapping. Not too bad.
**External memory run: (200 iterations) **
For reference the size of the external memory segment used by the CoreMark application is only ~11kB (44x256 byte blocks) so it easily fits the cache and no row replacement is happening. I could maybe drop my cache row count and see it thrash.
If you're compiling at -O0 without the basic move elimination stuff, your code is probably significantly larger than it should be, anyways.
Yep. I'm going to start adding back the safer optimizations, to see what the results are and will update this post. The default optimizations almost doubled performance in the internal memory tests above (ie. regular hubexec operation).
UPDATE: results for enabling optimizations according to using -O0,inline-small,regs,const,special-functions,peephole
Looks like it went from 11 to 18 iterations per second - big performance improvement. Now we running at about 18/30 of optimized internal RAM code (minus Fcache) or ~60%. So this is still reasonable. My assumption from the prior work a few years back was a bit under half of native speed but it is obviously highly dependent on the code itself as well as the size of its working set, plus I still have to get it working with real PSRAM which might assist it further. I should look at that next.
ps. code size went down from 11k to 7800 bytes after optimizations were added back in.
@rogloh
That's impressive. Catalina does about 17 per iterations per second for coremark using Hub Exec. But that's at 180Mhz. Why do you use 160Mhz? Is it something to do with your external RAM hardware?
EDIT: Of course, the good thing about coremark (over dhrystone etc) is that it has built-in support for multi-processing. Catalina gets a coremark score of 82 using 5 cogs. Will your new hardware support multi-processing? Catalina's current XMM RAM implementtaion cannot, which is why I generally have to use both NATIVE and XMM modes at the same time (e.g. with Lua). It would be great not to have to do that.
Ross.
160MHz is just the default for flexspin C . We could choose anything below maybe ~340MHz if the HW supports that rate. Also note that 11 iterations per second was obtained with all default optimizations disabled. Once I enabled them again (except for Fcache) it boosted up to 18 per second at 160MHz.
Haven't considered it yet but in theory multiple COGs running from external memory could each have their own I-caches and share a common external memory, with a commensurate reduction in performance. The main limitation here is that this model doesn't keep directly accessed data in the external RAM, just code, although bulk data could be stored there and indirectly accessed through R/W transfer APIs. I imagine its just a bit too much of a performance hit due to latency and also requires more extensive compiler support to try to store data in external memory. What I've done in my scripts (mainly performing FAR calls and branches in a certain way defined earlier for external memory segments) is about the bare minimum to get it running and would hopefully not be difficult to integrate with the flexspin compiler.