

New PNut-Term-TS downloader, debug application for P2 development on Windows, Mac, Linux (yes, RPi)
 Stephen Moraco
Posts: 459
Stephen Moraco
Posts: 459
PNut-Term-TS is the result of combining PST (Parallax Serial Terminal), PNut debug windows, and a downloader into a single application and porting it to a platform-agnostic language (in this case, TypeScript). It currently supports all nine debug windows, provides full logging, and has full PST functionality. It is built to handle debug traffic via serial at our full 2Mbit rate. The Single-Step debugger is still under development, so this is a v0.9.1 release.
v0.9.1
Initial release of PNut-Term-TS cross-platform debug terminal
- Support for Parallax Propeller 2 debugging protocol
- P2 download implementation with RAM and FLASH support
- Serial communication up to 2Mb with DTR/RTS control line support
Nine Debug windows implemented:
-- Terminal window with full ANSI escape sequence support
-- Logic analyzer window for digital signal analysis
-- Oscilloscope window for analog signal visualization
-- XY scope display window for phase relationships
-- Plot window for data graphing and visualization
-- FFT spectrum analyzer window for frequency analysis
-- Bitmap display window for image visualization
-- MIDI interface window for musical dataAlso features a logger window for message capture and analysis
- Cross-platform packaging for Windows (x64, arm64), Linux (x64, arm64), and macOS (x64, arm64)
- Command-line launcher pnut-term-ts for all platforms
- Electron v33.3.1 runtime bundled in all packages
NOTE: As we were doing final testing, we found an issue on Windows. As a result of this late finding this release is for MacOS and Linux/RPi only. We'll need a couple of days to find and fix this.
We will officially release a v1.x.x PNut-Term-TS when we've completed the Debugger capability.
PNut-Term-TS is found at its new Public Repository (repo), while the latest Releases are also found there at the Releases Page
Issues with PNut-Term-TS can be filed at the repo issues page, or, of course, you can report issues here in this thread.
This is an early version. I've tried to be comprehensive in my testing, but there's a lot of functionality in this first release. I look forward to hearing about your successful use and any issues you may encounter. Thank you for helping test this early version!
Comments
Sounds really good Stephen. I've been somewhat limited in the past with the Mac platform and all the fancy debugging stuff possible on the P2 (trying out Wine only ever gave me problems with serial ports etc) so if your new debugger tools works on the Mac platform too now that'd be nice to finally try out. I typically tend to use simple editors like Vim with flexspin command line stuff so hopefully the binaries created by that environment would still work out nicely with your own tools as well.
Hi Stephen,
thank you for this new tool and all your work done so far developing cross-platform tools for the Propeller. Nice to have a debugging tool supported on all OS platforms. I'm also using a Mac and tried the arm64 version.
Instead of adding each individual application directory to the PATH one should add the application to an appropriate existing directory which exists already in the PATH.
For third party tools I suggest to use /usr/local/bin where e.g. Python and NPM are located if installed.
You can install PNut-Term-TS in the application directory as you did and then make a link to the pnut-term-ts script in the directory /usr/local/bin with this command.
ln -s /Applications/PNut-Term-TS.app/Contents/Resources/bin/pnut-term-ts /usr/local/bin/pnut-term-tsYou need root rights for this but you have this already during installation or let the user it do. Afterwards pnut-term-ts is ready to use.
The pnut-term-ts script must be enhanced to work correctly if it is linked in this way. I have attached my changes (added .txt to allow upload).
For my test I have used a binary which was build with Spin Tools IDE. The little program uses two cogs. I used 2Mbit for communication. The logging of debug was working fine but for cog 0 it shows unexpected output and that 4 times the same.
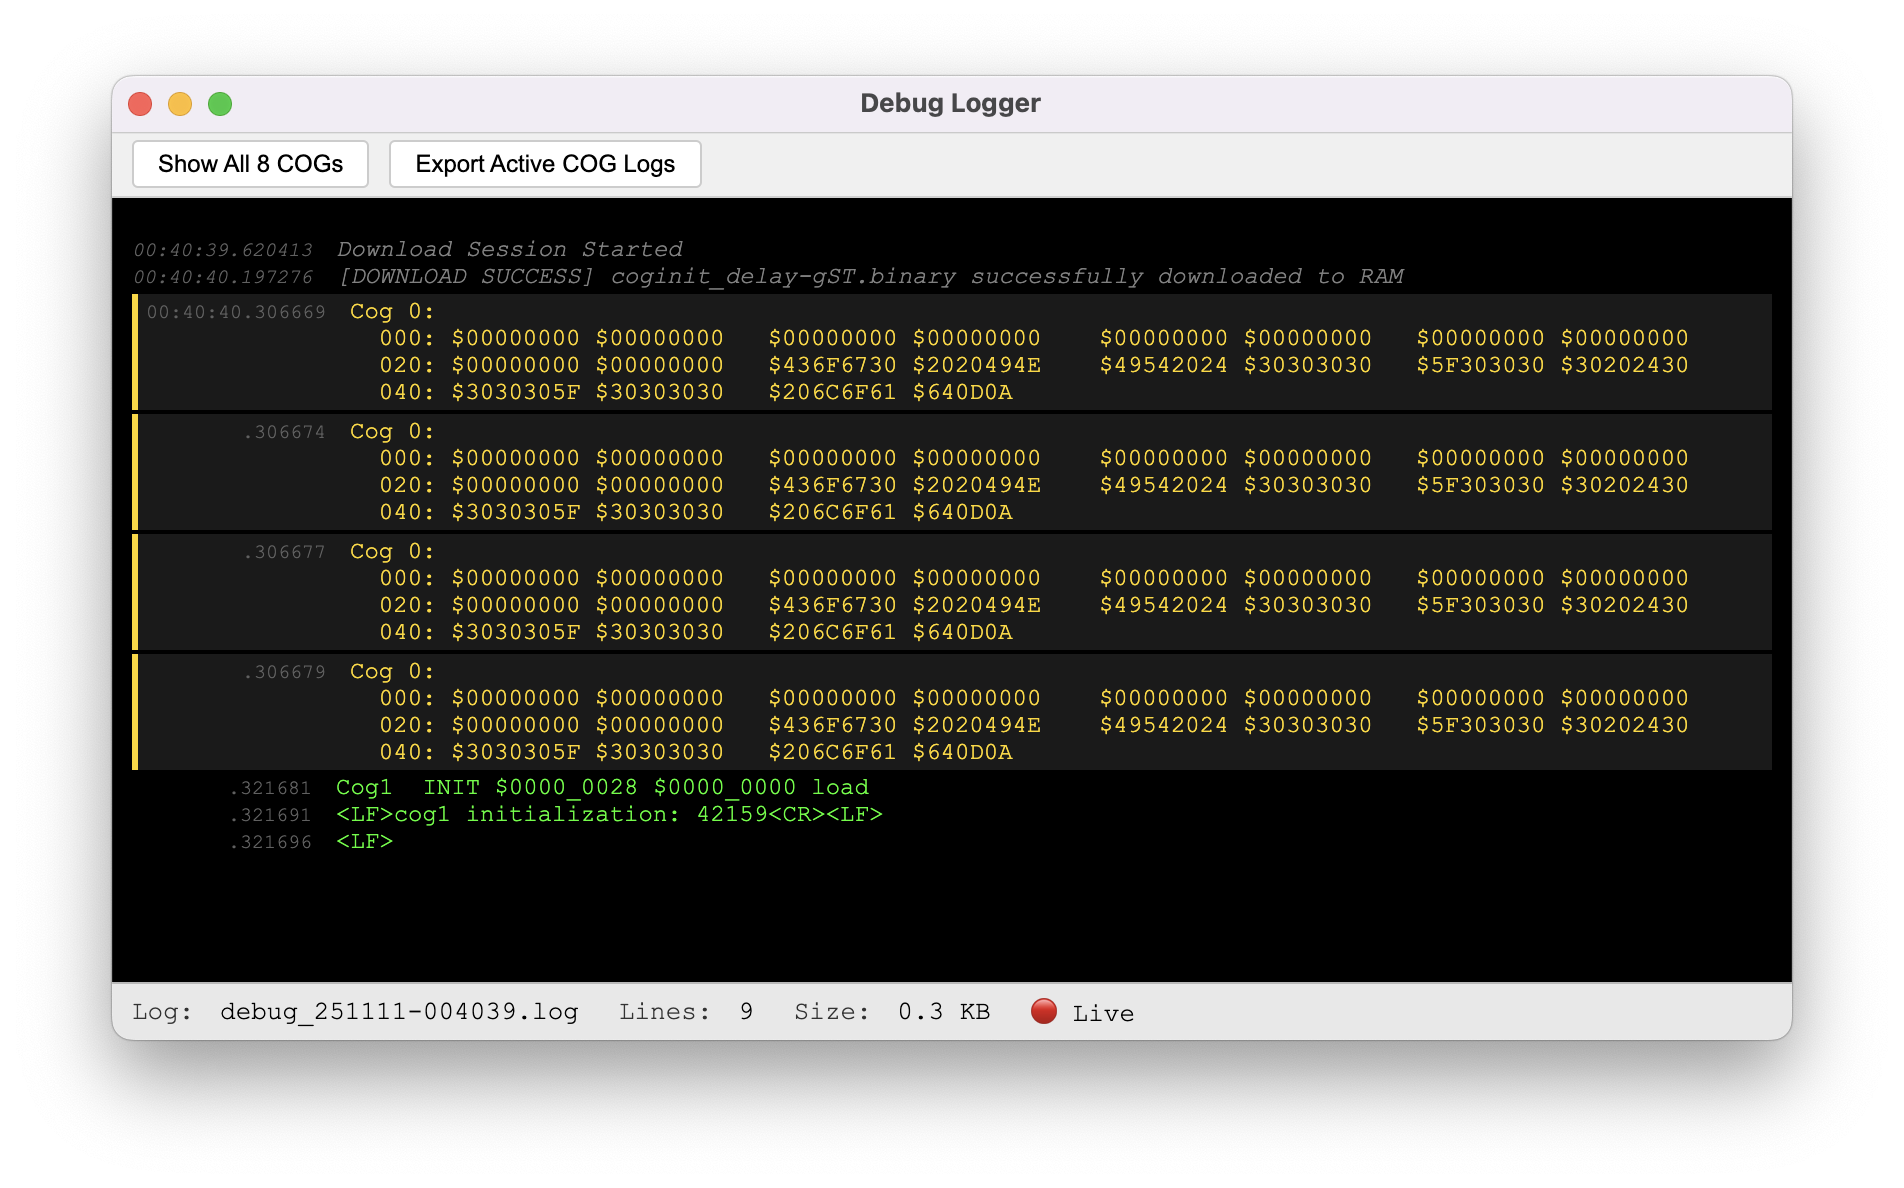
There is some hex output instead, but it looks like this is from the missing message for cog 0.
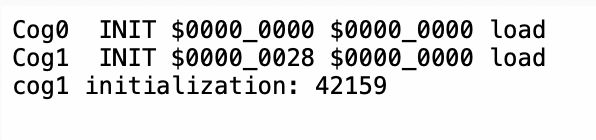
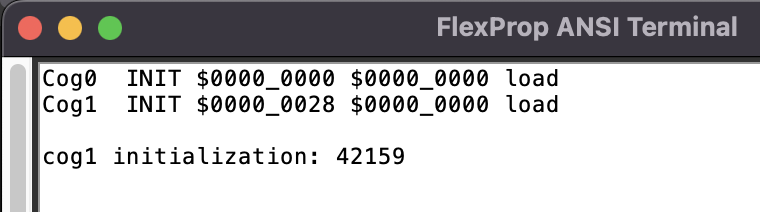
The same binary shows the expected debug logs with Spin Tools IDE and FlexProp. On FlexProp you can use "Run binary on device..." from Commands menu to try.
In the debug window and in the log file the message from the program is shown with the used control characters (line feed and new line) instead of doing it. This is not the case for messages coming from debug kernel.
On the other used tools it is printed as expected.
In the log file the timestamps are shown as UTC but the file name uses local time.
Overall I can say it is working so far but differ from the output of other tools.
Thank you! I'm happy to hear that it's been useful.
Regarding "make a hint regarding installation"— I, too, am a longtime Mac user. I'm trying to make the app install for us as standard as possible, hence, the drag to applications/ method. I'm reluctant to make this change, but I'll study what you sent and see what you are proposing.
We handle many message forms in this app. So there is some pretty sophisticated detection and routing. I'll run your case and see what I need to adjust/fix. The control char display should only happen for non-CogN messages, so it's likely a detection problem here too. More soon.
I hadn't noticed. Thanks for pointing this out. I'll use local time for all timestamps.
Thanks again, watch for an updated version coming soon.
Only for clarification, the installation to the applications directory is fine. Only how to have the pnut-term-ts script be able to execute, without modifying the PATH variable, should be changed.
@Kaio, I ran your application. The binary with a PNut term to see what you were seeing in the logging. Here's what I saw:
You can see that your message (undecorated) is shown in the main window, which interprets CR, LF, PST Commands, etc.
But in the logger, the control codes are shown, so we can actually see what we are receiving from or sending to the P2. This way, we can actually see ANSI sequences, clear-screens, and similar things being sent from the P2 appear in the log. We see what they are, so you can verify that you're sending them in correctly, even when the display in the main window isn't painting as you expected.
This is a design choice, not an error. Does this make sense?
I'm trying to use this with Linux and get this error:
The fix is fairly easy as it tells you what to do, however I'm a bit reluctant to have an executable with setuid privileges...
Anyway, I find very interesting how you handle the debug messages... I think I'll borrow the idea for my IDE...
Edit: after fixing the permissions, there is another issue:
I have an old prop-plug (not sure which version), lsusb reports this:
I didn't notice that the message was also printed on the main window. I was only inspecting the debug logger window as it is used on other tools.
If it is a design choice to show the message in this way it's fine for me. I was comparing the logs with the output of other tools and not aware of this.
But with the version I have tested the output in the debug logger window was different from yours. Maybe you have it already fixed.
This is fixed in v0.9.2 and later. Unneeded security was enabled by default. It isn't anymore.
Macca, always feel free to use. It's open source. I'm pleased that you liked it. Having similar features is only a good thing for our community.
I solved this for VSCode, but I hadn't thought to apply the fix here. This will take me a day or two to noodle... (how best to apply what I did in VSCode.) Do you have another you can use in the meantime?
Good.
I have another but is of same type (purchased together).
No rush, I can wait for the next release with the fixes, no problem.
NEW:
NOTE: As we were doing final testing, we found an issue on Windows. As a result of this late finding, this release is for macOS and Linux/RPi only. We're still working to find and fix this.
We will officially release a v1.x.x PNut-Term-TS when we've completed the Debugger capability.
PNut-Term-TS is found at its new Public Repository (repo), while the latest Releases are also found there at the Releases Page
Issues with PNut-Term-TS can be filed at the repo issues page, or, of course, you can report issues here in this thread.
This is an early version. I've tried to be comprehensive in my testing, but there's a lot of functionality in this first release. I look forward to hearing about your successful use and any issues you may encounter. Thank you for helping test this early version!
@macca , @Kaio please try the v0.9.3 build. It now fixes logging, and @macca, both of your issues. Please let me know if these are now resolved issues.
The sandbox issue is still present:
After fixing the permissions it works, I have to use the -m switch but works, thank you.
I don't understand the -p parameter, it seems that is ignored or falls back to the auto detection when there is only one Prop-plug connected, I tried -p /dev/ttyUSB1 (non existant) and still falls back to the Prop-plug on /dev/ttyUSB0). Wouldn't be better to display an error instead of falling back to the auto-detected device, even if there is only one adapter ?
Also, I would like to suggest to use the specified device regardless of whether it is actually a Prop-plug or not. I guess the Prop-plug VID/PID are Parallax own, I think this may cause problems with custom boards that may use FDTI adapters (or not) but don't have the corresponding VID/PID, if I understand correctly the -m switch ignores VID but still check PID and will still fail. In other words, -p should not make additional checks on .
Also, just noticed that if I have more than one adapter connected and don't specify a device, it say to use File -> Select PropPlug but there is no "Select" menu in File.
Edit: just realized that the VID/PID are the FTDI default, nevermind, anyway I think that using the specified device without additional checks would be better.
@macca, good test results. Thank you! I'm looking into all of this, more soon.
NEW:
NOTE: Our latest findings are that the windows issue is only on arm64 (or arm64 running under Parallels on macOS.) So we've added the Windows builds now. So one or more of us on Windows can determine if it's working and report back.
We will officially release a v1.x.x PNut-Term-TS when we've completed the Debugger capability.
PNut-Term-TS is found at its new Public Repository (repo), while the latest Releases are also found there at the Releases Page
Issues with PNut-Term-TS can be filed at the repo issues page, or, of course, you can report issues here in this thread.
This is an early version. I've tried to be comprehensive in my testing, but there's a lot of functionality in this first release. I look forward to hearing about your successful use and any issues you may encounter. Thank you for helping test this early version!
@macca , please try the v0.9.4 build. It now fixes both of your issues. Please let me know if these issues are now resolved.
The sandbox issue is not resolved:
Out of curiosity, I tried the linux-arm64 version on a Raspberry Pi and it doesn't have the same problem with the sandbox, it works without touching the permissions, I'm starting to think that there may be something with my Ubuntu 24.04 settings.
Using the -p parameter with a non-esistant device it exits with an error (good), however seems that the device is still checked for VID/PID, I need to use the -m parameter even with -p (I think would be better to not check the device VID/PID in this case).
Aha... looks like the effect of Ubuntu AppArmor, I have the same problem with the Arduino IDE (wasn't using it for a while), it too uses the Electron framework for the UI.
Here is the Github issue https://github.com/arduino/arduino-ide/issues/2429 in case you want to look at the discussion.
For me, I'm fine with adjusting the permissions.
So far, this is by design. I suppose it wouldn't be too hard to marry the -m behavior with the normal flow. Look for all FTDI devices, then qualify with Parallax to know that it uses DTR... and let RTS be a manual adjustment to then "known" device. Thoughts?
I'm so glad to know that AppArmor causes the Sandbox issue. I hadn't been able to see any working cases in my test systems. ;-)
I'll document the adjustment needed on Linux machines running AppArmor. Thanks for the link to the issue.
NEW:
This is the final update enabling use of pnut-term-ts with our Spin2 VSCode extension v2.5.0, which is now also released.
Well, my concept is that the command line arguments overrides all default or configured options. If I specify -p /dev/ttyUSB0 I expect the program use that device regardless if it is an FTDI device or not, if the device is already configured then use the settings, if not use the defaults. Other command line parameters like --rts (or --dtr) overrides the default or configured settings, as well as debugBaud or anything that may be configured. Priority should be command line -> configuration -> default.
The -m parameter is not really a problem, I could point out that I have prop-plug that is not dected as such without the -m parameter, but I can live with it.
The main problem may be that it is limiting the usable devices, AFAIK, currently, there is no way to use a serial adapter that is not FTDI (a sort of "vendor lock-in" from a certain point of view). What if someone uses a CH340 adapter ? Or something completely different like a dedicated microcontroller ? I built a serial adapter with a PIC microcontroller, I'm using it mainly with a P1 but it also works with the P2.
In my IDE I don't have access to USB details, I can't filter by device type (but I don't think I would have done that anyway), I had to add a blacklist to exclude certain devices from the auto-detection process to prevent unwanted access to devices detected by the OS as serial devices but actually not serial adapters (like, if I'm not mistaken, some Bluetooth audio devices).
Of course, checking the device type allows to use the serial number instead of the device name, this is certainly an advantage, maybe the best of both worlds would be to check the device type as a default for auto-detection or if the -p parameter is not a device pathname.
While testing your uSD driver demo, I noticed an inconsistency in the terminal output, here is an example with a simple program:
The CR with PST also does a linefeed, while with PNut-Term-TS does a CR only (the first line is overwritten by the second line in the screenshot). Don't know why it misses the last line with the three dashes, maybe because it doesn't end with CR/LF.
I think this "breaks" the output from other programs, look at the P1 EEPROM explorer, all output is on one line as it uses CR only.
Is that expected ?
(There is an inconsistency in Spin Tools PST emulation as well, related to the LF that will fix soon).
Rookie here: I'm setting up VScode for use with the P2. I've installed PNut, PNut-TS and PNut-Term-TS. I'm testing my setup with a classic Hello.spin2 but I don't know how to invoke PNut-term-ts from within VScode. Any hints?
If you have all that installed, good work so far. Your answer can be found in the Set up your VSCode environment section. Look for the topic: "Platform setup:, " then follow the link for your OS. When you get there, scroll down to the section for "Tasks in VSCode" that should give you the final steps and ways to ensure it's all working. While you are on that page, review the setup for each tool. If your installation differs from that prescribed on this page, you may need to make some adjustments. You should be able to check VSCode settings for the Extensions section for spin2, then review what's showing in the toolchain. If your compilers and pnut-term-ts are all found, then finishing the tasks part should get this all going for you. Please let us know how this works for you.
Stephen, I tried to get PNut-TS working in Fedora 42. I had Claude Code do all the work and we worked on it for 5 hours, but we finally gave up and dumped everything. I think the actual problem was with PNut-Term-TS. The terminal window popped up every time I tried to load a program with VS code and another window popped up on top of that to say it could not connect to the P2. Claude Code prepared a bug report. Don't take his requests too seriously. I don't really expect you to fix this. I just want to let you know we couldn't get it to work in Fedora Linux. The first item about the installation path might be interesting for anyone else trying this in a non-Debian version of Linux. I have been using Spin Tools a lot with Claude Code for both P1 and P2 and it has been working well. Claude Code works much better with P2 now that he has access to documentation. Claude Code also works much better with P1 now than it did last year as well.
Subject: pnut-term-ts v0.9.6 — Cannot connect to P2 on Fedora Linux 42 - Report prepared by Claude Code.
System:
- OS: Fedora Linux 42, kernel 6.18.13-100.fc42.x86_64
- pnut-term-ts: v0.9.6 (2/13/2026)
- pnut_ts: v1.52.2
- Electron (bundled): 33.4.11
- PropPlug on /dev/ttyUSB1 (FTDI, confirmed working)
Summary:
pnut-term-ts cannot load its terminal window or connect to the P2 on this Linux configuration. The tool compiles the Spin2
file correctly but the download and terminal never complete.
Issues found:
Installation path note. On Fedora Linux, the XDG Base Directory Specification places user application
data under ~/.local/share/ rather than /opt/. The actual Electron binary and resources installed to
~/.local/share/pnut_term_ts/pnut_term_ts/, but the launcher script at ~/.local/bin/pnut-term-ts references
$DIR/electron and $DIR/resources/app/.... Manual symlinks were required to make the script run at all —
mentioning this in case the installer was written with a Debian/Ubuntu layout in mind.
Stale lock files. If a session crashes, /tmp/pnut-term-context-*.json files are left behind. On the next launch,
pnut-term-ts detects these and exits with WARNING- Another instance is already running. These files should be cleaned up on
startup if the owning PID no longer exists.
Electron renderer sandbox blocks serialport native module. The GUI relaunch runs without --no-sandbox, causing the
Electron renderer to throw a Napi::Error (empty message) when the serialport native addon is loaded. This crashes the process
silently.
BrowserWindow fails to load temp HTML file. With --no-sandbox forced via LD_PRELOAD, the crash is resolved but the
BrowserWindow then fails to load its HTML file from /tmp with ERR_FAILED (-2). This leaves the terminal showing "not
connected to a P2" with no download occurring.
Workaround:
Using spinc -r file.spin2 -t (Spin Tools) for compile, load, and serial terminal works correctly on this system.
Request:
Could you investigate Linux Electron sandbox compatibility? The tool works on Windows but appears to have unresolved issues
on Linux with Electron 33. Adding --no-sandbox to the launcher script for Linux would resolve issue #3, but issue #4
(BrowserWindow ERR_FAILED loading from /tmp) requires investigation on your end.
@TheoHaugen, fun to hear, sorry about the problems. I have two things I would like you to try, then please report on your experiences.
In the long run, this will also support the P1, but we are months away from that, yet.
The "fun" aspect you should see with the headless and the MCP combined is that Claude can now study, write code, compile it (pnut-ts) and then download and run headless (pnut-term-ts) wait for the tool to end then study the logs (it instruments the code with debug() statement) then adjusts the code to correct the behavior and then does this all again.
Oh, and yes, I'm not surprised, but the dysfunction on other Linux distros, I thought I fixed those issues. I'll study this a bit to see if there's anything I can do. I do appreciate the AI-generated report! They're not always fully correct, but they certainly provide great detail as a starting point!
Stephen, I agree with you about AI being."not always fully correct." I have decided to set up a virtual machine and have another go at trying to get PNut-TS working in Fedora. With a virtual machine, if it doesn't work I can just dump the whole thing rather than having to clean up the mess.
I have been using the p2kb MCP with Claude Code on Fedora 42 along with Spin Tools for quite a while. It has made a huge difference. The only problem I have is that with Spin Tools there does not seem to be any way for Claude Code to see any output to the terminal or any debug messages, so I am looking for something where he can do that.
I did try to get VS Code and PNut-TS and PNut-Term-TS working together in a VM with the help of Claude Code in Fedora. It was easy to get PNut-TS and PNut-Term-TS working and that is going to be great. We tried to get VS Code to work with it, but we just couldn't do it, so we were probably making some sort of mistake, and working in a VM adds its own set of complications. Claude Code doesn't need VS Code and I am no fan of IDEs, so I am happy with the situation.
Did my latest release with spin2 corrections and a new tasks.json file help with this issue at all? (I realize I still need to address the GUI on Fedora issue. Updated pnut-term-ts coming soon for you to try.) But builds should now work well.
I'm looking at your report. Can you retest pnut-term-ts use (with the latest version) to see if there is still an issue firing the GUI? Some of the issues in the report have already been addressed.