

bme680 sensor
 Rsadeika
Posts: 3,901
Rsadeika
Posts: 3,901
I got some bme680 sensors from Parallax, and they are working. The setup is: Raspberry pi 3, Adafruit bme680 driver, Python.
When I run the Python script, the temperature, humidity, pressure results are very straight forward. The problem that I am having is the results for the gas reading.
I have this setup inside the house, and the reading that I am getting is 22203 ohm. Not sure of what to do with this ohm reading. The chart that Adafruit provides does not show anything that is in ohm results. Since I am not a hardware guy, not sure what to do with these results.
Anybody solve this problem? Thanks in advance for any information.
Ray
Comments
Section 4 of the datasheet talks about employing BSEC software to manage the continuous calibration sequence that then converts from resistance to air quality index and others. The link in the datasheet is dead but this one with email request exists - https://www.bosch-sensortec.com/software-tools/software/bme688-software/
You can also run this sensor on the P2 using the BME68X driver from Bosch.
Works right out of the box.
/**
 * @brief BME68x Environmental Sensor
 * @author Michael Burmeister
 * @date December 7, 2019
 * @version 1.0
 *
*/

//#define DEBUG
//#define BME68X_DO_NOT_USE_FPU

#include <stdio.h>
#include <propeller.h>
#include "simpletools.h"
#include "i2c.h"
#include "bme68x.h"

#define SAMPLE_COUNT  UINT16_C(30)
#define BMESCL 36
#define BMESDA 37

i2c_t *Bme;
char bmemode;


int main()
{

    uint8_t dev_addr;
    uint16_t sample_count = 1;
    uint32_t del_period;

    /* Heater temperature in degree Celsius */
    uint16_t temp_prof[10] = { 100, 100, 200, 200, 200, 200, 320, 320, 320, 320 };

    /* Heating duration in milliseconds */
    uint16_t dur_prof[10] = { 280, 5740, 280, 1960, 1960, 1960, 280, 1960, 1960, 1960 };

    printf("Starting\n");

    Bme = I2C_Init(BMESCL, BMESDA, I2C_STD);

    //bmemode = BME68X_SEQUENTIAL_MODE;
    bmemode = BME68X_FORCED_MODE;

    struct bme68x_dev gas_sensor;
    struct bme68x_conf conf;
    struct bme68x_heatr_conf heatr_conf;
    struct bme68x_data data[3];
    uint32_t time_ms = 0;
    uint8_t n_fields;
    int ct;

    dev_addr = BME68X_I2C_ADDR_HIGH;
    gas_sensor.variant_id = BME68X_VARIANT_GAS_LOW;
    gas_sensor.intf = BME68X_I2C_INTF;
    gas_sensor.read = BME68xRead;
    gas_sensor.write = BME68xWrite;
    gas_sensor.delay_us = BME68xWait;
    gas_sensor.amb_temp = 25;
    gas_sensor.intf_ptr = &dev_addr;

    int8_t rslt = BME68X_OK;
    rslt = bme68x_init(&gas_sensor);

    printf("Results: %d\n", rslt);

    uint8_t set_required_settings;
    /* Set the temperature, pressure and humidity settings */
    conf.os_hum = BME68X_OS_16X;
    conf.os_pres = BME68X_OS_1X;
    conf.os_temp = BME68X_OS_2X;
    conf.filter = BME68X_FILTER_OFF;
    conf.odr = BME68X_ODR_NONE;
    rslt = bme68x_set_conf(&conf, &gas_sensor);

    /* Set the remaining gas sensor settings and link the heating profile */
    heatr_conf.enable = BME68X_ENABLE;

    /* Create a ramp heat waveform in 3 steps */
    heatr_conf.heatr_temp = 300; /* degree Celsius */
    heatr_conf.heatr_dur = 100; /* milliseconds */
    heatr_conf.heatr_temp_prof = temp_prof;
    heatr_conf.heatr_dur_prof = dur_prof;
    heatr_conf.profile_len = 10;

    rslt = bme68x_set_heatr_conf(bmemode, &heatr_conf, &gas_sensor);

    printf("Config Results: %d\n", rslt);

    /* Trigger the next measurement if you would like to read data out continuously */
    rslt = bme68x_set_op_mode(bmemode, &gas_sensor);

    printf("Sample, TimeStamp(ms), Temp(deg C), Pressure(Pa), Humidity(%%), Gas resistance(ohm), Status, Gas Index, Index\n");

    ct = _getms();
    while(sample_count < SAMPLE_COUNT)
    {
        /* Trigger the next measurement if you would like to read data out continuously */
        if (bmemode == BME68X_FORCED_MODE)
            rslt = bme68x_set_op_mode(bmemode, &gas_sensor);

        del_period = bme68x_get_meas_dur(bmemode, &conf, &gas_sensor) + (heatr_conf.heatr_dur * 1000);

        gas_sensor.delay_us(del_period, gas_sensor.intf_ptr);

        time_ms = _getms();

        rslt = bme68x_get_data(bmemode, &data, &n_fields, &gas_sensor);

        for (int i = 0;i<n_fields;i++)
        {
            printf("%6u, %13lu, %11.2f, %12.2f, %11.2f, %19.2f, %6x, %10d, %4d\n",
                sample_count, time_ms, data[i].temperature / 1.0f, data[i].pressure/3386.4, data[i].humidity / 1.0f,
                data[i].gas_resistance, data[i].status, data[i].gas_index, data[i].meas_index);

            sample_count++;
        }
    }


  while(1)
  {
    _waitms(1000);

  }
}

uint8_t BME68xRead(uint8_t reg_addr, uint8_t *data, uint16_t len, void *intf_ptr)
{
    int i;

    uint8_t dev_addr = *(uint8_t*)intf_ptr;

    i = I2C_In(Bme, dev_addr, reg_addr, 1, data, len);

#ifdef DEBUG
    printf("Read> i:%d, addr: %x, reg:%x, Len:%d, (%x)", i, dev_addr, reg_addr, len, data[0]);
    for (int j=1;j<len;j++)
        printf(", (%x)", data[j]);
    printf("\n");
#endif

    if (i > 0)
        return 0;
    else
        return -1;
}

uint8_t BME68xWrite(uint8_t reg_addr, uint8_t *data, uint16_t len, void *intf_ptr)
{
    int i;

    uint8_t dev_addr = *(uint8_t*)intf_ptr;

    i = I2C_Out(Bme, dev_addr, reg_addr, 1, data, len);

#ifdef DEBUG
    printf("Write> i:%d, id:%x, reg:%x, len:%d\n", i, dev_addr, reg_addr, len);
#endif

    if (i > 0)
        return 0;
    else
        return -1;
}

void BME68xWait(uint32_t period, void *intf_ptr)
{
    _waitus(period);
}
Ops, you may have an issue with the I2C driver on the P2 for C code. I use my own I2C driver.
Mike
Thanks. I have not fully looked into evanh suggestion. That lead, requests an email to get the necessary library file. Not sure if I will get what I need.
I have looked into a P2 suggestion, ran into multiple problems.
What I want to do is put together the cheapest plug and play solution for an outdoor thermometer assy. So far, using a raspberry Pi 3 or maybe a raspberry pi 4, seems to be cheapest and relatively reliable solution. Since I do a lot of data logging, using some kind of software socket code, has to be available. Plus having some kind of battery backup for the assy would be beneficial.
I already ordered some more bme680 sensors from Parallax, at $15, I might have to order some more, hope the sale lasts a little bit longer.
Now that I am thinking about it, getting the gas thing functional, for the bme680, would be a useful piece of data to log. Would be nice to know the quality of the outside air.
Ray
The cheapest model would be to use an ESP32C3 with ESPHome and Home Assistant.
You don't have to write a lick of code and all you need to do is plug in the bme680 to the ESP32 and ESPHome will write the code and hook it up to Home Assistant.
Home Assistant requires a Raspberry Pi to run which sounds like you already have.
Mike
I am looking at your 'Living Room' display, and it looks like the gas data is in ohm. Does that need to be adjusted or the BSEC library has to be implemented.
Ray
Right, I didn't have a chance to install the BSEC library example and just did the simple one which I had already done.
Mike
Yesterday I put together a raspberry pi 3 and the bme680, and put the unit outside, to get some data. I have a logging program which creates a .csv file to load it to my sqlite 3 database. Now I will be able to work some data using sql.
Yesterday I took a gas reading, in the late afternoon - 22274 ohm. This morning I took another gas reading - 52697 ohm, interesting numbers. I will have to check out my log file to see if I can make some sense out of this.
Ray
Here is what I see from inside the house with Home Assistant.
Mike
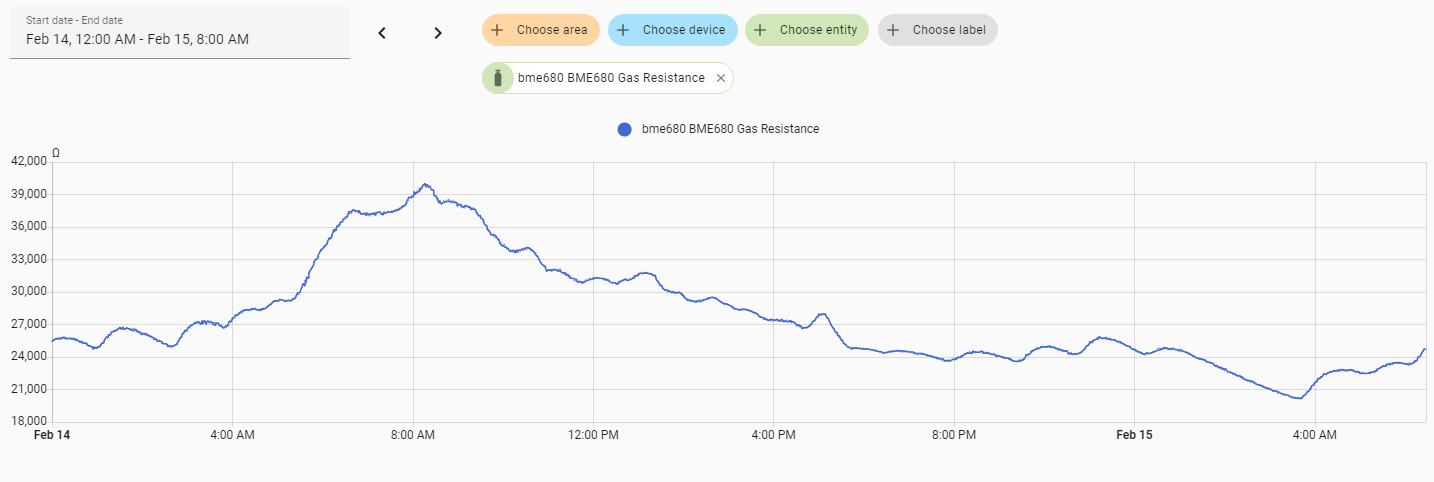
I stumbled on to a home assistant forum where they have a discussion about the bme680 gas readings. I get the impression that the higher the ohm number, the more resistance, which means the better the air quality.
So, looking at the graph above, it looks like around the 8:00 AM period the air quality is pretty good, then it starts to drop off. Anything in particular that is occurring at the 8:00 AM time.
Ray
I went to make breakfast. The unit is sitting on my desktop.
Mike
I get up around 4:00.
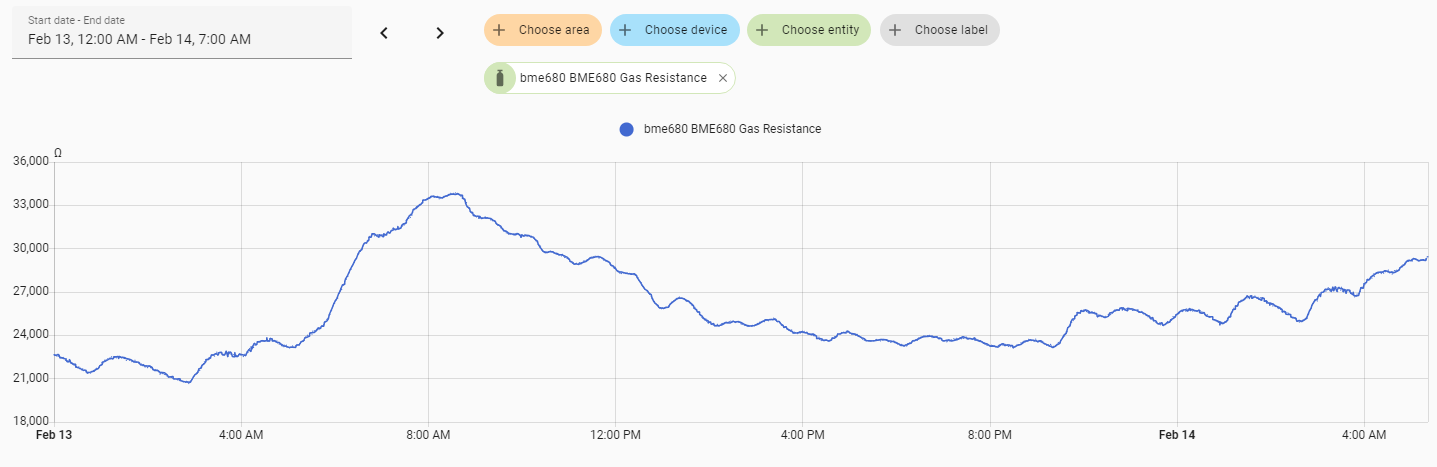
I hope the png shows up in this post. I have a bme680 unit setup in my living room and I am grabbing data every 10 seconds, for a 24 hour cycle, which is stored in a .csv file. I then load that into my SQLite 3 database. I have a python program that allows me to graph the data that was collected. The graph was created by a modplot program.
I am assuming that the large ohm numbers show the good air quality. The below graph shows a 24 hour period 00:00:00, the left side, and 24:00:00, on the right side. The low point span in the graph shows when the furnace is on. I have the thermostat set to where the furnace starts up at 05:30:00 and shuts down at 18:00:00. Those times do correspond to the graphs low points.
I guess this kind of shows that there is a change in the quality of the air, but it does not show me what the quality is.
The sensor has many different heating profiles that can be applied to measure different types of gases. You would need to use there AI studio to learn a profile that would detect the type of gas you are interested in.
That's where the feather board come into play. Watch the video by Bosch.
Mike
So far I have some bme680 units outside, sun room, bedroom, and attic. I have them data logging temperature, humidity, gas, and pressure. The one outside also does altitude. I am finding some interesting numbers for the gas results.
The outside bme680 unit is recording a gas ~300,000 ohm at the highest, while some of my indoor bme680 units are recording a gas ~30,000 ohm at the highest. Using the outside number as a base for comparison, it does not look good for the indoor readings. I wonder if I can conclude that I am breathing in some stale air, inside the house.
The one thing that I found out is that the outside bme680 unit is not reading temperatures at 0 F , in fact it sort of locked in a reading of 14 F for the whole data capture, for the whole day. When I do a single reading manually, the reading seems to come in correctly, although I did not test it when the temperature was at 0 F.
Is anybody else having a problem with the bme680 reading temperatures at 0 F?
Ray
I moved my BME680 to an outside building and it seems to work just fine. The resistant seems to follow the temperature though.
No problem with temperature:
Mike
My graphs are showing similar results. I also added a graph for humidity, so, which is having an affect on the gas, humidity or temperature, or both. It would be nice if I had a home AI system, then I could train it with my .csv data. I could then give my brain a rest, and have the AI do the number crunching, creating graphs, ... etc.
Back to number crunching.
Ray
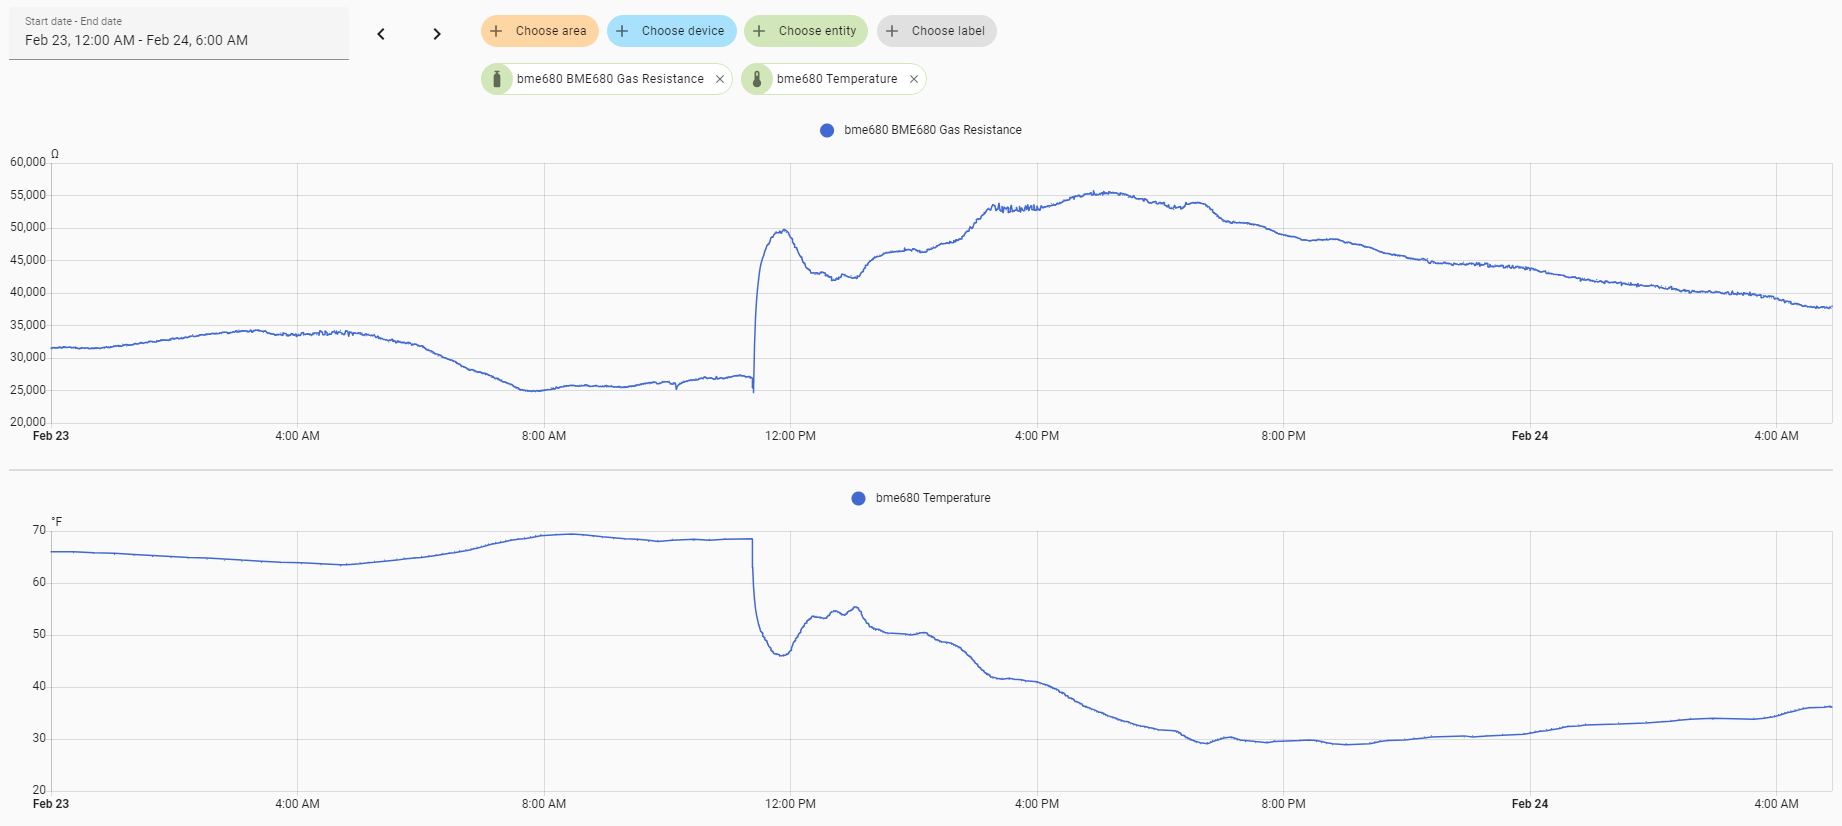
This is an interesting development. I just had a biology refresher, plants give off carbon at night, and produce oxygen during the day.
The graph below is data from the sunroom/foursesons room which I have a lot of plants. Now looking at the graph, looks like the higher ohm numbers reflect CO2 and the lower ohm numbers reflect oxygen production. My original assumption about the ohm reading seems to be wrong. The graph below - left side 00:00:00 and the right side 24:00:00.
Some of the spikes, in the lower numbers, during the daytime may be explained by the sun shinning into the room. This is interesting, it seems that that the plants are showing some activity, during the twenty four hour time frame.
Ray
(https://forums.parallax.com/uploads/editor/gu/qr1pe0h9ye3c.png "")
Just an up date on this project, yes it turned into a larger project than anticipated. I have eight BME680 stations, consisting of, an Rpi3 using Python, and a BME680.
One sta is outside logging the streaming data. The attic sta is also logging streaming data. And so are the stations in the basement, kitchen, bedroom, living room, study, and sun room. I have all the data being submitted to my SQLite database for detailed analysis.
The purpose for all this, I wanted to get an idea of what the differences are through out the house.
On the software side, it would be nice to implement some form of agentic. I wonder if the P2 could be made to be a mini agent.
Now I have to learn how to really use SQL and pandas for analytics.
Ray
I am sort of satisfied with the setup of this project. But, it is getting to be a hassle trying to automate the capture of all the data, on different units, and having it data logged for processing of the data.
I am trying to get to a point where my server talks to the individual sensor units, gets some specific data, and proceeds with a report and/or supplies a web page with the data. And the server just might have to do some specific mechanical function with the specific data that was acquired.
I was thinking about implementing the P2 or the P1, but Parallax does not offer any type of off the shelf material that could replicate my current setup.
Ray
I believe, that @RossH has implemented a P2 based sensor and actor network.
A few years back, I was experimenting, using an Activity WX board and the the BME680 module. I had a WEB page setup, and could see the data on a browser of my choice. Since I wanted to capture the data and data log it, that is where this setup started to fall apart.
Now that I want a server to be the central factor, I am now looking into different ways of getting what I want. This looks like it might be a difficult undertaking. I am, once again, open to different suggestions.
Ray
Mine is an experimental lash-up at the moment, cobbled together with chewing gum and bits of string. When I get a chance to get back to it, I might think about adding MikroBUS support.
Ross.
Since the P1 Activity board is now gone, I do not see myself fiddling around with the FLiP. So, that leaves the P2 as an option.
So I am thinking how to I get communication with a P2 unit via a LAN or WiFi and my server unit. The idea is to replicate my Raspberry pi BME680 setup using some sort of P2 unit setup. Simple IDE does not support the P2, so that eliminates a lot of established code. If I add the WX WiFi SIP module, I think that there is a lot of limitations with the existing firmware that is available. Can the P2 unit with a WiFi module be setup to make a connection with another unit allowing for access to the P2, I guess a small OS would be needed. The OS, of course, would not be a linux or anything like that.
OK time to wake up and get something going...
Ray
Depending on what access to the P2 you need, Catalina can already do that, either in C or (my preference) in Lua (since you can then develop your programs on the P2 itself). Catalina's OS for the Propeller is called Catalyst.
Downloading software developed on one P2 to the other is not currently implemented in Catalyst, but should be easy to add since the WiFi module already supports it - you would just have to implement the protocol on the sending P2, which should be fairly easy. There is a thread about doing that from a PC here - so if that is written in C (I haven't checked) then you pretty much have everything you need.
Ross.
I would be interested in using Catalina, if it were as simple to start and use as Simple IDE. I tried starting Catalina once before, to many moving parts, did not have any success.
Ray
P2 works just fine. You can configure a URL on the WiFi module and send it a request, and it will respond with the weather data.
{"time":1756442304, "voltage":8042, "current":26, "temperature":2775, "humidity":6713, "pressure":2939, "light":208}I use Visual Studio Code as my IDE and then compile it with flexprop to load onto the P2. I started with the P1 but found the P2 uses less power. The code is almost identical between them.
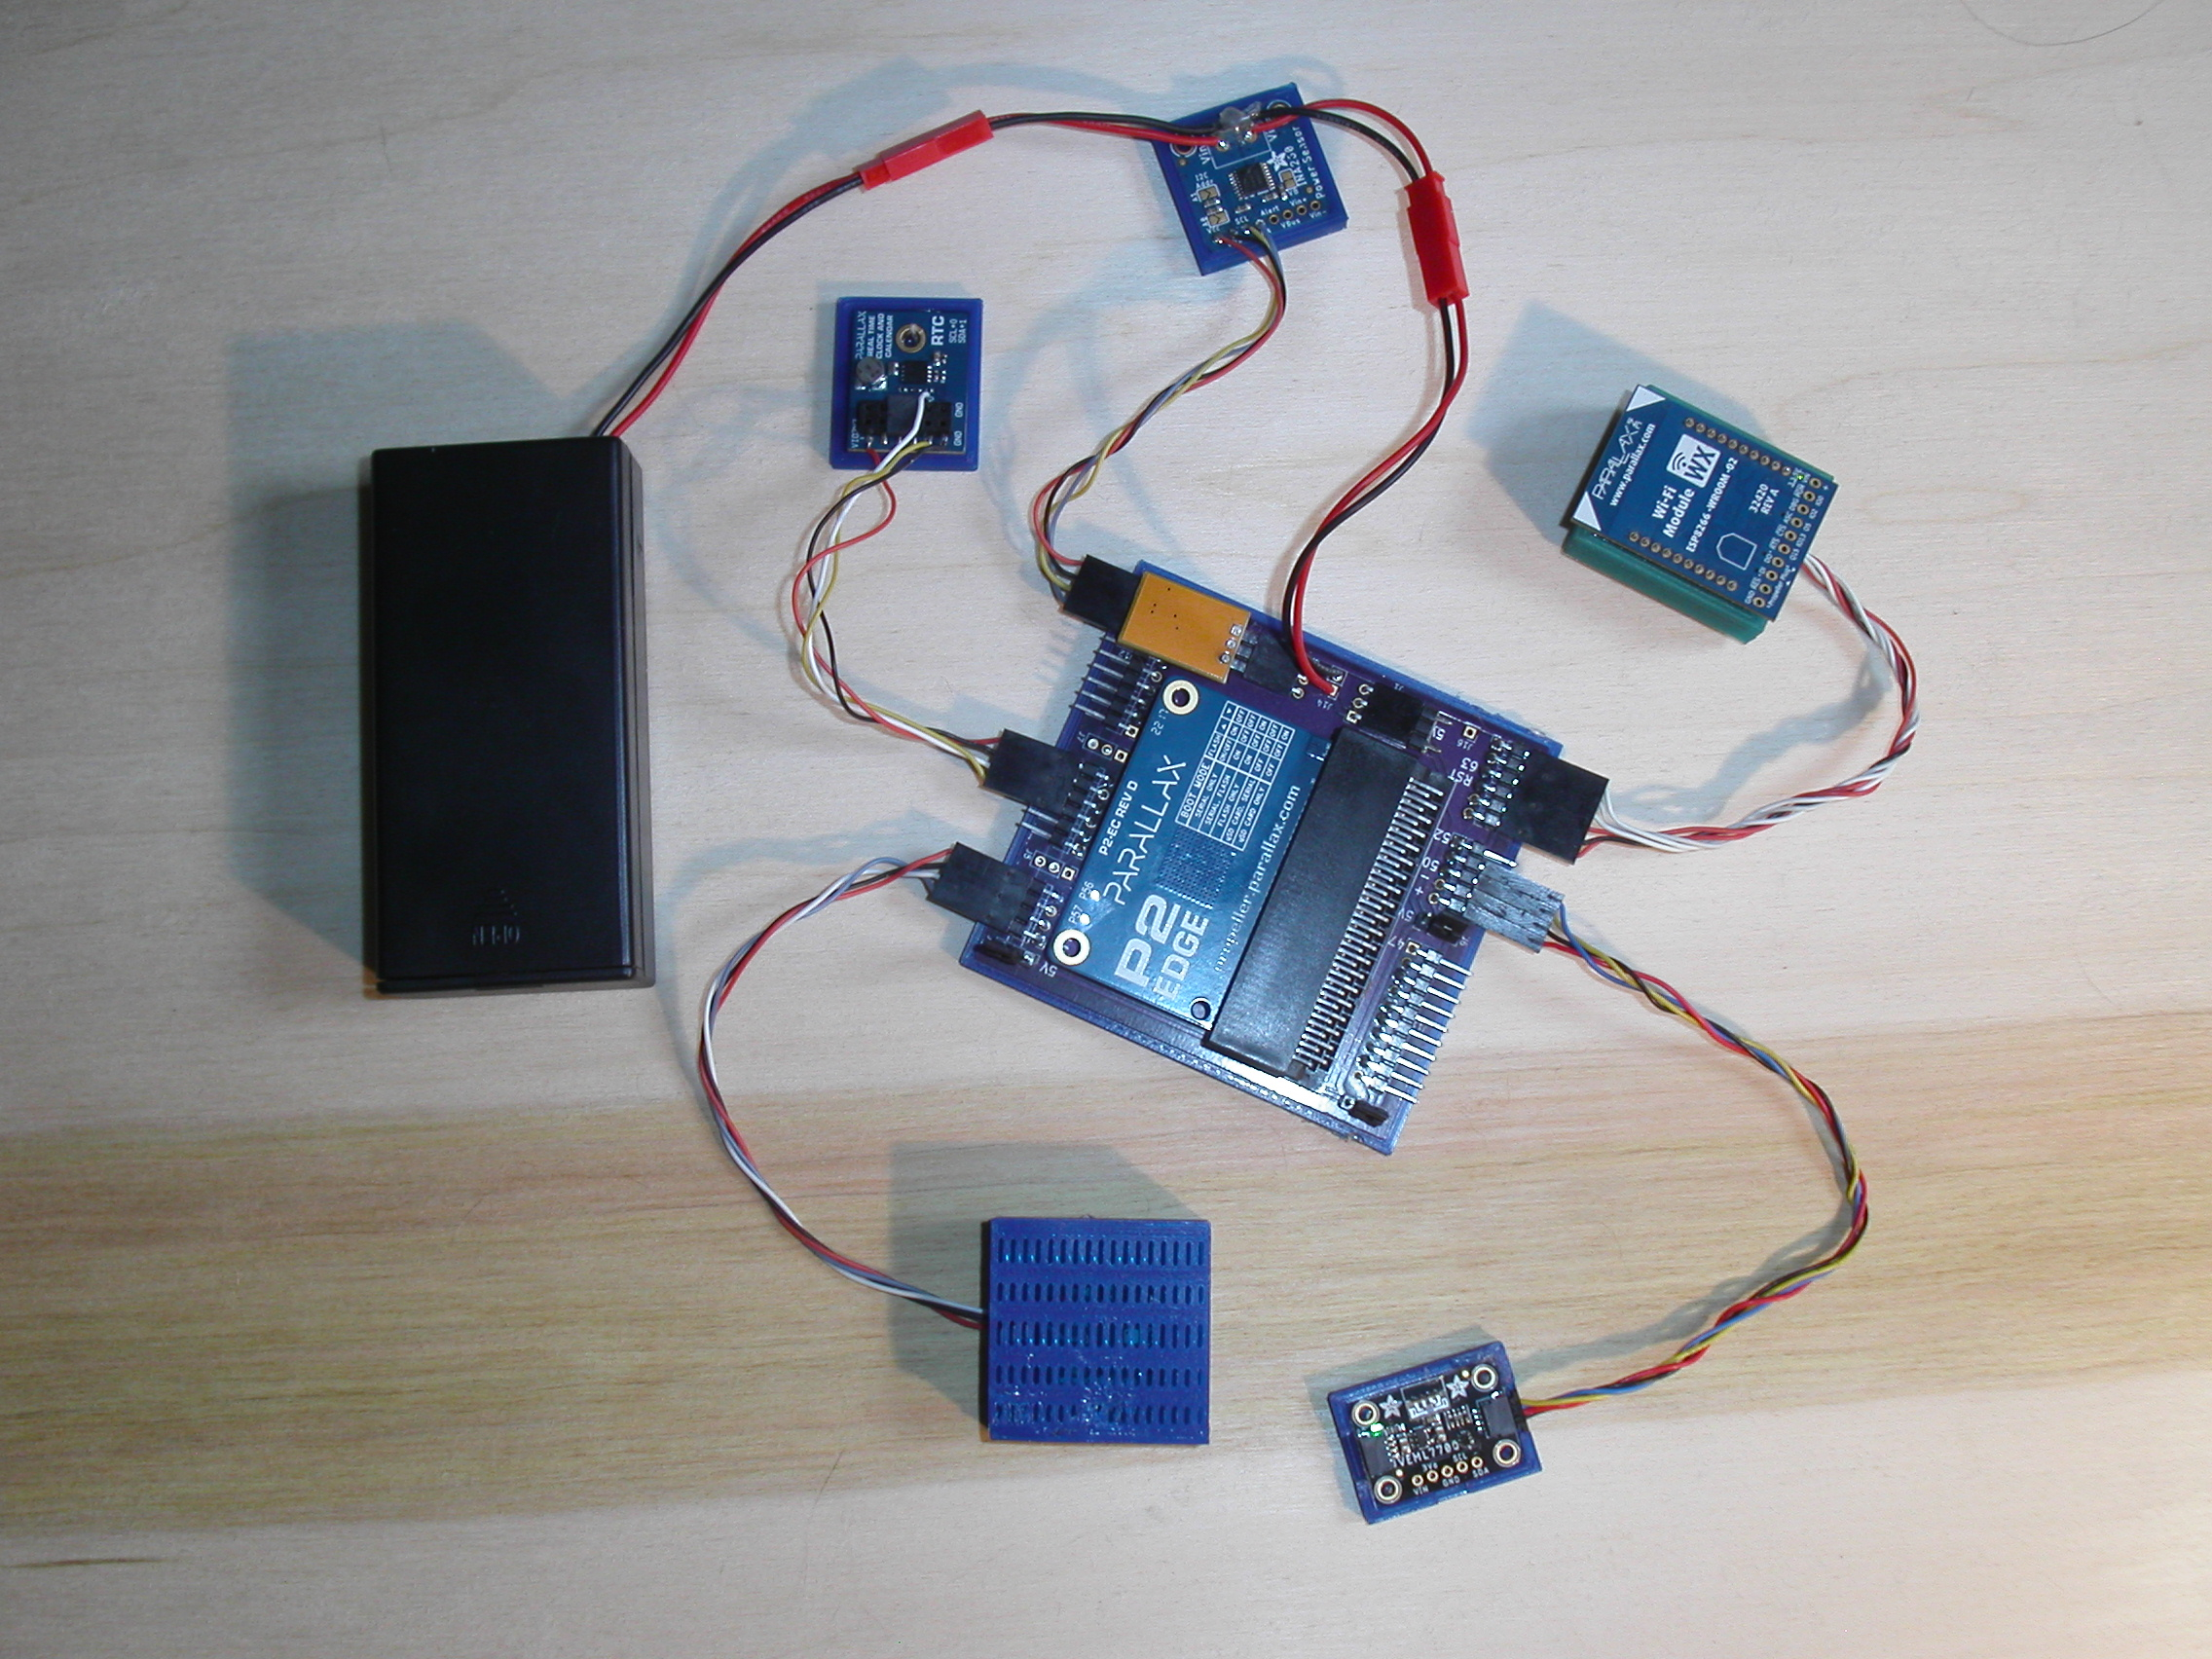
Standard WiFi module.
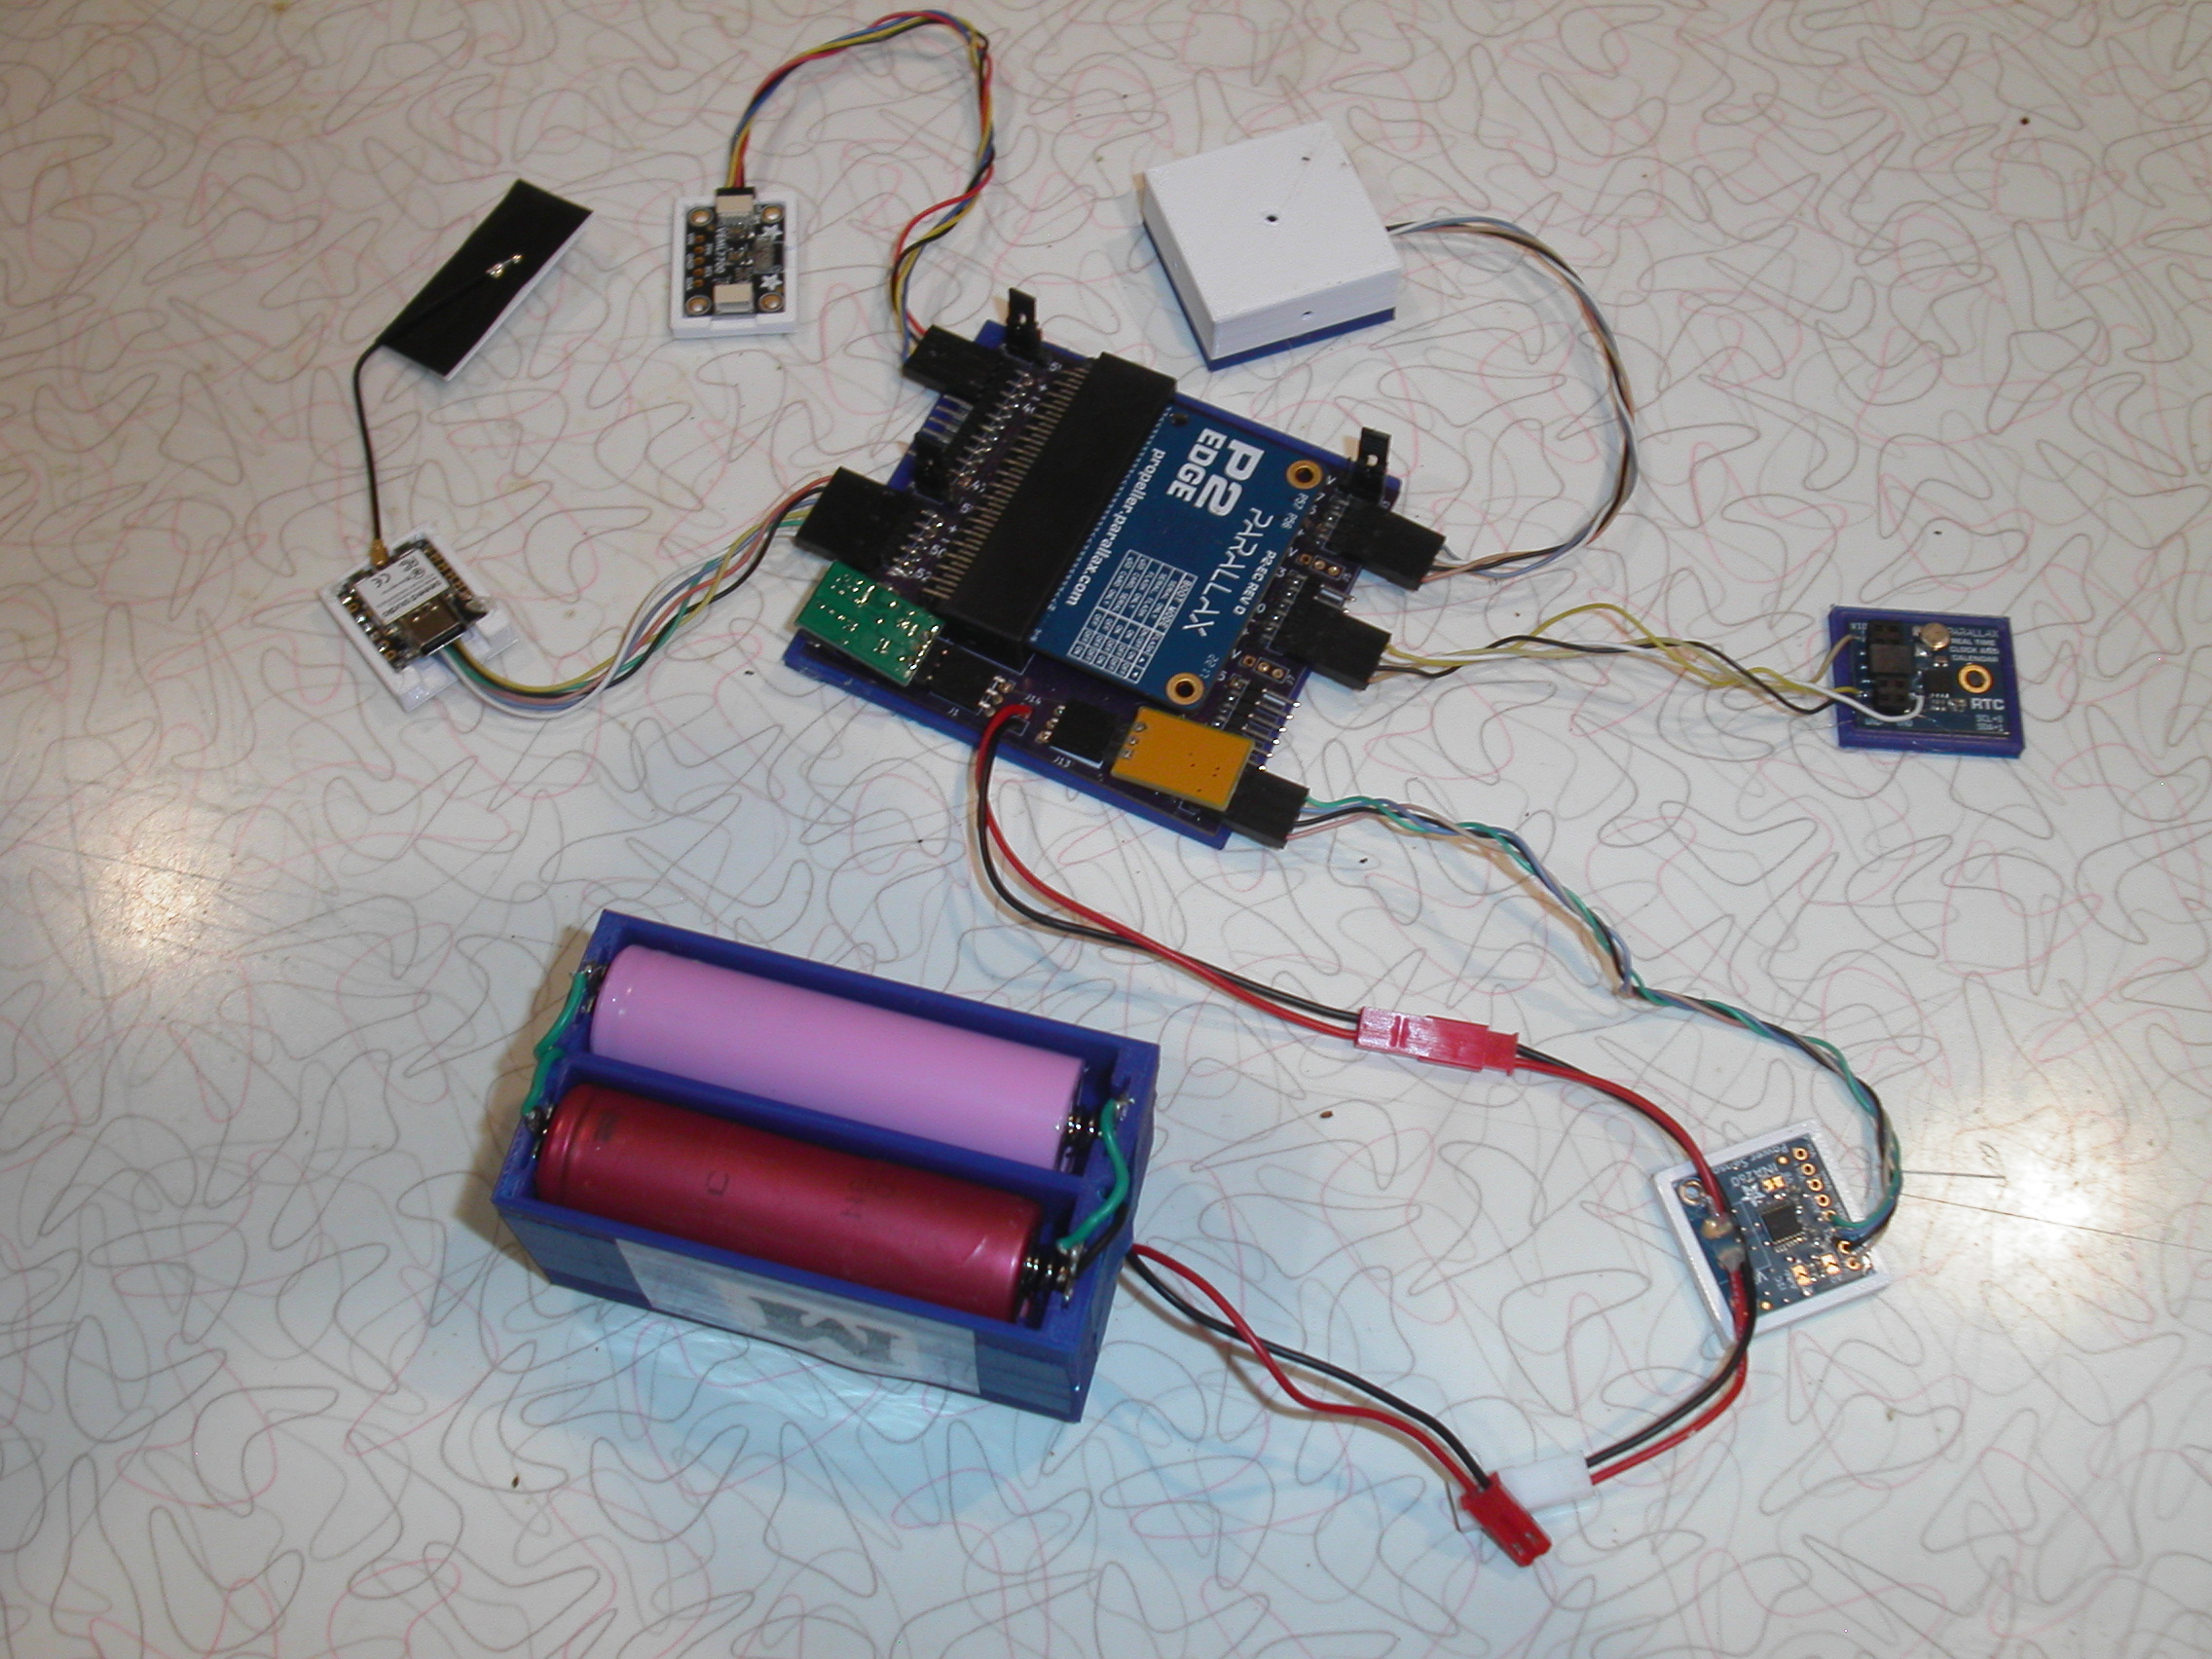
Using an ESP32 module with update WiFi code. The ESP32 module uses less power.
Mike
Let me know what went wrong, and what platform you are using. If it was Windows 11, I have only just started using that myself, but with a few minor tweaks everything now seems to work ok.
Ross.
So I went to the github site, and...
You should have the Windows binaries at the top of the page, with a download selection for a specific version. I am not interested in a package that you have to compile or build or ...
Ray
Go to SourceForge for the Windows Installer - https://sourceforge.net/projects/catalina-c/
Ross.
So, I went to the sourceforge site and did the the download, double clicked on the downloaded file, and it says I have to download some kind of app, too many moving parts.
Where is jazzed when you need him to update Simple IDE to be able to use the P2. For that matter why hasn't Parallax updated it to the P2.
So, what is the last resort, micro:bit.
Ray
No, it is a normal Windows Installer that provides everything you need. If what you are seeing is simply Windows warning you that this is an app from an unknown publisher (me!) you can simply tell Windows to proceed with the installation anyway (from memory, click on the button that says "More Info ...").
Ross.