

I/V curve tracer project - Prop I
 ChrisGadd
Posts: 311
ChrisGadd
Posts: 311
For those not familiar with it, an I/V curve tracer is a bit of specialized test equipment that plots the current through a component over the voltage across it. The circuit at its simplest is a sine-wave generator, ammeter, and voltmeter.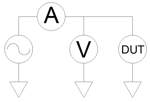
Voltage is plotted on the horizontal axis and in the next image ranges from -5V to +5V. Current is plotted on the vertical axis and ranges from +5mA to -5mA.
Current and voltage are in a linear relationship through resistors.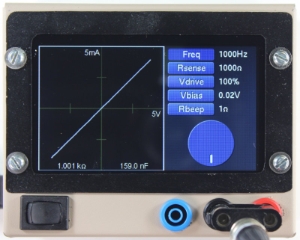
Current leads voltage through capacitors.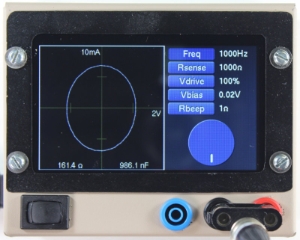
Rectifier diodes pass current in one direction, starting at about 600mV.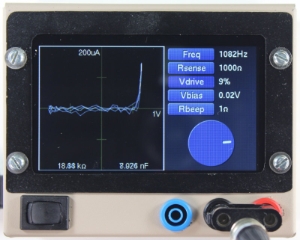
Zener diodes have a reverse-conduction region.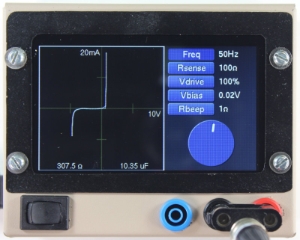
SCRs require a bias applied to the gate. This SCR is right on the edge of switching on, the rising sine-wave voltage pushes it over the edge.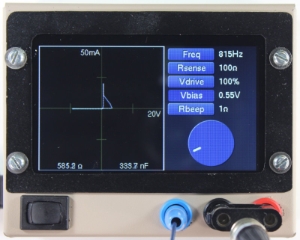
Inductor signatures supposedly look like rhomboids, but I’ve never managed to get that picture. At best, a 1000uH inductor looks like a lop-sided capacitor signature.
Transistors look like a rectifier diode between collector/base, and look like a zener diode between base/emitter.
I first encountered curve tracers many years ago as a home-made circuit in a small box, called an octopus, that connected to an oscope’s x and y inputs. The lab I’m currently working at has a commercially-made Huntron ProTrack I, but it’s somewhat bulky and the user-interface is less than intuitive.
This Propeller project started out as a result of fiddling with ADCs, determining how accurately I could measure various signals through different components, and viewing the readings as line-plots in excel (actually libreOffice Calc). I gradually refined the circuit and added a touchscreen display, and now have a curve tracer that I feel is at least comparable, if not superior, to the Huntron. It’s much smaller and easier to operate, provides resistance and capacitance readouts, and based on ebay prices, is a lot cheaper. The Huntron does have a wider voltage range, +/-20V sweep vs. +/-10.2V for mine. The Huntron also has a compare mode, for comparing a known-good circuit board against a suspected-bad board, though that’s not anything I use in my line of work, and would be easy enough to re-design in.
I’m using a MAX544 14-bit DAC to create a 50Hz to 5KHz sine-wave up to 2.5Vpk. The DAC is driven with a dedicated cog running PASM code in a tight loop. A start method reads angle values from the Prop sine table, scales those values by the ‘Vdrive’ percentage on the touchscreen, and populates a 64-long table that gets loaded into the cog. The ‘Freq’ button on the touchscreen adjusts the delay between sending updated values to the DAC. The DAC cog also writes the present angle to a variable used to keep the DAC and ADC synchronized.
The output of the DAC goes through an op-amp filter to smooth the steps, then a capacitor removes the DC component, then another op-amp amplifies the signal to up to +/-10V. The current is sensed using a differential input to a LTC2348-18 18-bit 8-channel, simultaneous sampling, bi-polar ADC. The current is sensed across one of four resistors; 10, 100, 1K, or 10K, switchable through optorelays connected to Prop pins and controlled using the ‘Rsense’ button on the display. A third op-amp section buffers the voltage, which is then read through a 2nd ADC channel.
The LTC2348 driver also runs in a dedicated cog running PASM code. While the LTC2348 does provide a separate data-out line for each channel, making it possible to read each with a different cog and enabling faster sampling, I found it much easier to read the current and voltage sequentially from one data-out line. There were some issues of re-combining the readings that produced erratic readings at specific frequencies that I never managed to resolve.
Even using all of my tricks, the fastest I could make the process of initiating the conversion, reading two channels of 18-bits + 6 status bits, accumulating, and preparing for the next sample, requires about 6.4us. Since I’m sampling the signal at 64 angles in each period, that limits the maximum frequency to 2.44KHz. In order to get up to the 5KHz frequency range, I added interleaved sampling. The ADC samples every angle (synchronized to the DAC) for frequencies up to 2440Hz, between 2440 and 4880 it samples every other angle in two passes, and above 4880 every fourth angle in four passes. In order to maintain a snappy update rate on the display, a complete sampling of all 64 angles is written to hub memory at least every 80ms, regardless of the signal frequency. Note: I chose 64 angles as a happy median; 32 angles resulted in a jagged-looking display, 128 angles didn’t offer enough improvement over 64.
The main routine in the Prop finds the highest values in the returned samples and sets the display scale for maximum clarity and plots the samples. The display is a FT813 EVE2 display, also driven by a dedicated cog running PASM code. To calculate the resistance, the absolute total volts is divided by the absolute total amps and then multiplied by Rsense, which provides the average resistance of all the samples. This value also happens to be the capacitive reactance of capacitors at the sine-wave frequency. Using the formula 1/(2pi * freq * Xc) provides the capacitance. In testing, the resistance measurement is somewhat to very accurate between 10 ohms and 1M ohms, capacitance is fairly accurate starting at about 1000pF, and remains accurate up to 1000uF.
The ‘Rbeep’ button on the display is a feature I’ve long desired in a continuity tester; the ability to sound the speaker at higher resistances. A lot of my work involves following traces on circuit boards, and when a trace disappears through a via into an internal layer, the only way to find it again is by probing around to find where it re-emerges. If I’m able to hear a tone when ‘Rbeep’ is set at 100-ohms, I’ll know I’m getting close.
Finally, the ‘Vbias’ button adjusts a counter set to duty mode and connected through a pin to another op-amp to produce a DC signal adjustable between -3V and +3V, primarily used for testing SCRs, though I have also experimented with using it as an automated transistor tester. The bias voltage is measured using a third channel on the LTC2348, and also read using a dedicated PASM cog.
I completed this project several months ago and the only improvements I might make if I were to do it again are a wider signal voltage and Kelvin (4-wire) inputs. The signal voltage is +/-10V, so naturally one of the first circuit boards I examined with this had 15V zener diodes, and I was not able to see the reverse-conduction region until looking at it with the Huntron. I experimented with using 4-wire inputs and was able to get decent readings in the milliohms region, but decided against it due to the added complexity in use, and not having the real-estate on the project box.
Comments
That's a pretty cool project Chris!
Thanks for sharing.
I’m shamelessly stealing parts of this! I’m working on a MPPT charge controller and your design has basically the entire analog measuring stage right there. That gives me a leg up for learning-by-doing.
Awesome project! Many thanks for publishing this gem.
Nice project, are you going to make a two channel version like a Huntrol
Huntron
can you share codes? eprom bin?