

What is Your Favourite Debugging Aid?
 Christof Eb.
Posts: 1,597
Christof Eb.
Posts: 1,597
Hi, I wanted to ask You, what methods you like to use to debug Your Propeller code?
(At the moment I have the problem, that after some hours, my P2 stops doing it's tasks. This is in Taqoz and while it still works I have serial console access, but when it has crashed, the serial console is dead. So now it's irrelevant, that this has been Taqoz, now it's just a dead system. Of course I have been trying to find problems, invoking routines separately, but obviously I did not find the problem. There must be some rare constellation....)
All in all, my question is more general about best debugging methods.
Christof
Comments
Perhaps I should mention, that I now try to use the TRACE feature of TAQOZ, which for COG0 outputs to serial the stack contents for each first level subroutine together with the name of the subroutine.
When things get bad, I will start making separate test programs to validate specific questions. Like how does a particular smartpin mode work when sequenced the way I'm doing it in the original program.
Then I make comments in the original source code about the way I've used that smartpin mode and what to be careful about, like specific order of setup.
I recently had such an issue where the device stop working after a random amount of time. The hardest part was figuring out where in the code it was going south.
Since random things can cause side effects such as the unit restarting having clear insight into the problem is key.
In this case the unit stopped dead in its tracks, and this meant there is looping code somewhere.
Stack is always a place to look when using cogs as they seem to use that up fast if not careful.
I like using LED's for finding where the code might be stopping. I turn on an LED and then later turn another LED on and after that turn them both off. This type of code is very small and doesn't impact other function. You don't want to interduce a bug looking for a bug.
For example I have this cog code that read data from the serial interface and store the data in a buffer.
void WIOE5_IO(void *par)
{
    int i;

    _wio = serial_open(_Wr, _Wx, 9600);

    _hd = 0;
    _tl = 0;
    _wtx = 0;
    _Rdy = 0;

    while (1)
    {
        if (serial_rxReady(_wio) != 0)
        {
            _WData[_hd] = serial_rxChar(_wio);
            if (_WData[_hd++] == '\n')
                WIOE5_Parse();

            _hd = _hd & 511;
        }

        if (_wtx > 0)
        {
            i = serial_write(_wio, _WCmd, _wtx);
            serial_txChar(_wio, '\r');
            serial_txChar(_wio, '\n');
            _wtx = 0;
        }
        usleep(50);
    }
}
When the code finds a new line character it call a function to process the data. The data is put into a circular buffer with a head and tail pointer.
This code ran for several hours before stopping. Finding it was a matter of luck since it was buried in a background task.
Using print statements in a background task doesn't always work since the main code opened the serial port.
Mike
+1 for using LEDs (or pins in general), they can be used anywhere without throwing any timing off by too much.
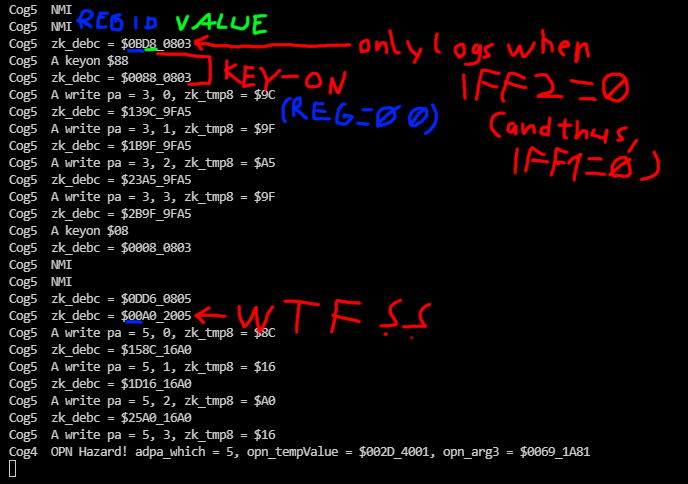
When dealing with intermittent issues, make sure you build a way to test-run that doesn't require your attention, for you will go insane very quickly if you don't. I found this out when trying to debug the last audio issue in NeoYume. I first had to nail down to what state causes the symptoms (as it were, YM2610's sample play pointer ends up behind the end pointer) and then I wrote code to detect whenever that state occurred. Then I could move up the chain and debug what leads to the invalid state without having to listen to the actual audio all the time to watch for the issue. (the issue ended up being that I reserved only a byte instead of a word for the current YM address and that caused the upper half to be overwritten with garbage whenever the next variable changes (and that variable got constantly overwritten, too, but it was non-critical, hub copy of animation counter)).
Insane scribblings from that time:
Yes, LEDs or better still a super cheap logic analyzer conncted to the pin(s).
The LEDs seem to be crude but with the tiny code placed here and there they are very effective.
I laughed out the LED idea at one point when dealing with the MSP430 micros (stupid me) but totally changed my line of thinking once I found out how efffective that method can be.
Ik now a clever expensive system using a character on the monitor screen.
On one place in the upper right corner of the screen, they print a letter on every branch change of the program.
The first thing on the part of the soft is print an unique ascii.
When you have e crash, the "frozen" character give a clue about the place where the crash occur in the app.
If you can spare an I/O for an LED, you can also use the same I/O to bit bang serial data. ... or just a series of pulses with minimal delay that a scope can trigger on.
{Code that actually does something}
bsf
bcf <- One pulse on scope ; we are here
{Code that actually does something else}
bsf
bcf
bsf
bcf <- Two pulses on scope ; we are here
{Code that actually does something even more}
bsf
bcf
bsf
bcf
bsf
bcf <- Three pulses on scope ; we are here
+2 for using LEDs.
Just one LED is enough. It drives me nuts when people make boards without even a single user-driven LED available. I have to wire one up to a pin, and this taxes my very limited hardware skills!")
I wrote a whole goddam source level debugger for Catalina ... but what I use most often is just the LED. If I need more than one bit of information, I make the LED flash out data in hex digits, coded as dots and dashes.
Ross.
(((At the moment I do hope, that I have found the reason for this crash. There was a "THEN" missing in my code. Astonishingly the compiler did not complain. Also by chance the routine did it's job. After the "IF" there was a word filled with something, where the forward jump would be put into normally. This something got interpreted as data, which was put onto the parameter stack, filling it very slowly.))) In this case the decompiler of Taqoz was very helpful and manually tracking stack depth via console.
In this case, the built-in TRACE routine is not so very helpful, because it prints too much and therefore slows down the system too much.
Yes, for many troubles an LED can be very helpful!
In ESP32-Arduino there is the Exception Decoder. As far as I understand, it takes the return stack chain and prints the names of the functions. Has helped me sometimes in a very straight forward way.
Perhaps one should have some sort of "flexible trigger" to start some output? Ideal would be a post trigger, which then can show some history which has to be recorded by a very fast routine in a rolling buffer?
Oh, I forgot to mention I'm also a big fan of an audio signaling in exchange for an LED.
It is much easier to notice and you do not have to constantly watch that LED.
I have this really old ( and I mean really old, 40 years+) soviet era, military 1000 Ohm earphone, in series with another 10 kOhm resistor that is perfect for the job and does not overload any pin.
On the downside, it gets noticed when in sounds by everybody else in the small room...
+1 for pins. I often use DRVNOT to tell how often a certain function runs. Smartpin repository mode is the fastest way to export a long.
Debugging USB is hard since it has strict timing requirements. The time it takes to print out an incoming packet "guarantees" that your response will be too late.
Having a bunch of cogs can help. I stripped the USB host software to make a simple USB sniffer. Since 12Mbps USB generates data much faster than a 2Mbps serial link can print it as hex, I added a circular buffer in hub ram. The sniffer used RQPIN on the same smart pins the USB device program used. It loops back the transmitted data too. The buffer readout was done on a different cog. I used the smartpin repository to transfer one long from the USB device to the USB sniffer which was then added to the buffer.