

Propeller Tool: Debug statements weirdness
 macca
Posts: 1,054
macca
Posts: 1,054
Hello,
I'm experiment with the P2 to learn how things are working, and noticed a weird effect of the debug statements on the View Info hex dump of the memory.
With this simple code (don't comment the code, I'm just learning), open the View Info (F8) window.
CON
  _clkfreq      = 160_000_000

DAT

        org   $000

cog
        mov     ptrb, #@lut-@cog
        debug (uhex_long(ptrb), udec_long(ptrb))
        setq2   #12
        rdlong  0, ptrb++

        mov     ptrb, srcptr
        mov     ecnt, #3
.loop   rdbyte  i, ptrb++
        rdlut   l, i
        debug (uhex_long(srcptr), uhex_byte(i), uhex_long(l), udec_long(l))
        djnz    ecnt, #.loop

        jmp     #$

srcptr  long    @prog

i       res     1
l       res     1
ecnt    res     1

DAT

        ' lookup table

lut     long    1000
        long    2000
        long    3000

DAT

prog
        byte    $00, $01, $02, $03
The F8 window:
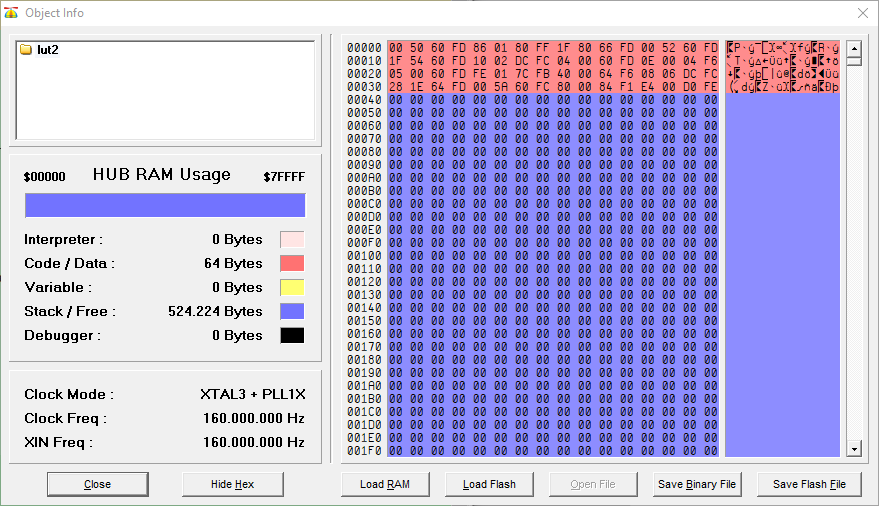
Can you see the last byte sequence (00 01 02 03) ? I can't !
However, if you comment the debug statements:
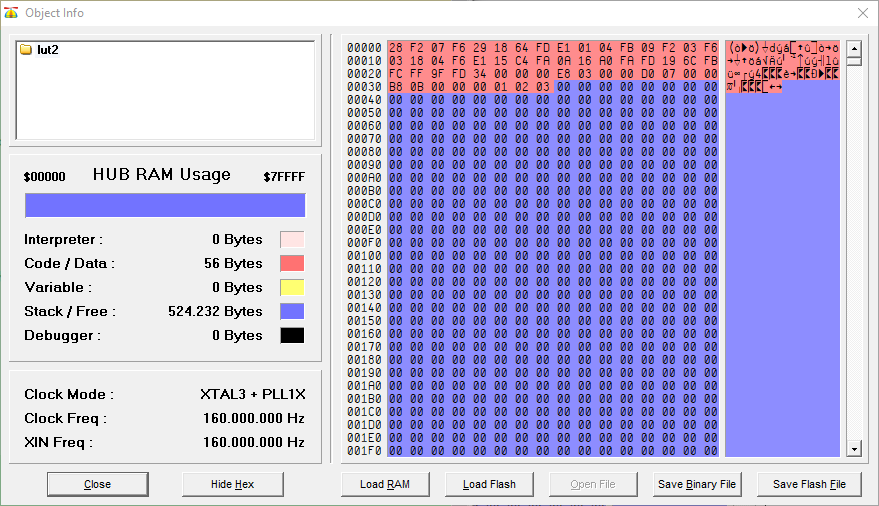
Here they are!
And the code bytes seems very different.
Seems that the debug statements are messing the hex output, but the program runs as expected so the actual loaded code should be correct.
Bug or something I don't understand ?
Comments
I think you found a bug. I used your code with PNut and below is the lst file from both examples- -- top is with debug, bottom without debug (using notepad++)
The Propeller Tool needs some work to properly reflect what got compiled. Jeff has this on his to-do list.
Cgracey
What kind of environment do you use with punt?
Can you recommend some kind of IDE working with PNUT?
PNut could work under Stephen Moraco's Visual Studio Code setup. I'm hoping he'll give us an update in today''s Zoom meeting at 1pm PST.
Propeller Tool that runs in Windows should soon be showing compilation output properly, though.
Chip is correct. I have developed most of my LED Matrix driver (in P2 Obex) using VSCode and PNut. See the quickbytes page for setup instructions. Upcoming: this environment will also make it easy to switch between various compilers for P2 (e.g., PNut and FlexSpin).
Regards,
Stephen