Michael, I realized that I just described the .obj file format, not the .bin file format.
The .bin file format is simply the bytes that are ready to send. The .bin file is only produced when you download to the P2.
In the case of Spin2 programs, the first thing is the interpreter program, then your binary object.
In the case of PASM programs, it's just the raw program data.
If you did a Ctrl-F11 (From PNut), to program the Flash chip, it will be either of the above, preceded by the Flash programmer.
Basically, the .bin file is the raw data to be downloaded, without any modification. If you look at the last section of the silicon doc, you can see the download protocol. It's all textual and pretty straightforward. You can do hex, which is really obvious, but text (BASE64) is more data-efficient, so it's faster.
I fixed the floating-point exceptions that could cause PNut to malfunction when doing graphical DEBUG displays. Also, DEBUG windows now close properly and the line-clipping now works like it's supposed to. I adopted the Cohen-Sutherland line-clipping algorithm, which works better than the one I had written. Mine was causing the occasional exception to occur. So, this version is just better-behaved. Jeff will be integrating this version of DEBUG into the Propeller Tool in the next few days.
Is there a particular reason as to why setting DEBUG_BAUD causes the debugger to not start?
2000000 is not a standard baud rate and because of very old, very stupid code, setting such a baud rate doesn't forward properly over an RFC2217 connection, so it'd be great if the debugger baud rate could actually be changed
@Wuerfel_21 said:
Is there a particular reason as to why setting DEBUG_BAUD causes the debugger to not start?
2000000 is not a standard baud rate and because of very old, very stupid code, setting such a baud rate doesn't forward properly over an RFC2217 connection, so it'd be great if the debugger baud rate could actually be changed
I need to add one more symbol to actually inhibit DEBUG displays from opening, instead of using a non-2Mbaud declaration.
I've been reluctant to change the DEBUG-display baud rate, because DEBUG communication continues right after download. Changing the baud rate could disrupt that. It might necessitate putting a time delay into the DEBUG initializer in the P2 code. If Windows lets me change the baud rate without forcing a serial port reset involving toggling control signals and such, that would make it simpler.
But, why would you want to change the DEBUG-display baud rate, since it's tightly tied to the Windows apps (PNut and Propeller Tool)? Or, are you just wanting the main DEBUG black/green window to open at a different baud rate?
As I said, 2M (and other unusual rates) are just not available in certain situations. The aforementioned RFC2217 tunneling setup (which I'm using to get around the buggy USB serial on the P2D2 I've gotten my hands on, but is just generally useful if the P2 is connected to a different computer) just sets the nearest supported rate instead (that being 1M). The download, being autobaud-ed, works fine, but the debugger then tries to send at 2M and only gibberish comes through. If I set DEBUG_BAUD to a different rate, the data comes through, but the debug windows don't open, which kindof defeats the point.
So yes, if the debugger would just open regardless of set DEBUG_BAUD, that would work here.
The Spin2 interpreter was shifted around a bit to free the first 16 LUT registers, to support 1/2/4-bit video in the same cog, via interrupt.
A new symbol DEBUG_WINDOWS_OFF was added to inhibit any DEBUG windows from opening after downloading. DEBUG_BAUD can now change the baud rate that PNut and the P2 communicate at.
@cgracey said:
But, why would you want to change the DEBUG-display baud rate, since it's tightly tied to the Windows apps (PNut and Propeller Tool)? Or, are you just wanting the main DEBUG black/green window to open at a different baud rate?
@cgracey said:
A new version 35h was just posted:
.... DEBUG_BAUD can now change the baud rate that PNut and the P2 communicate at.
Great. It's always a good idea to allow user BAUD control, as not all serial links are using the same drivers and pathways.
Usually someone would choose the fastest useful speed, which may be 1M for the RFC2217 mentioned above, or it may be 3MBd or even up to 12MBd for someone using a P2 with a FT232H/FT2232H Bridge.
The UB3 in the P2D2 can manage bursts faster than 3Mbd, so depending on the debug packet size, values above 3MBd might be practical there too. ( 24MHz/N is the supported formula)
Until SiLabs fix their driver bug** of a purely SW imposed baud ceiling, for the UB3 with values above 3MBd 1MBd are accessed by setting the N value. (eg so Baud=6 gives 4MBd link speed)
** addit:
I just downloaded the Silabs driver 10.1.10.103, and even tho the release notes say this MCUSW-651 | Support baud rate up to 2187500 for CP2102, CP2104, CP2109
it now allows me to enter any value up to 12Mbd for UB3 without coughing any (bogus in my mind) SW error for values above 1MBd, so they have fixed that issue
@cgracey said:
Hey, have you used the new flexible baud feature yet in PNut_v35h?
(replying in this thread because on-topic)
Yes, seems to work. I haven't had a chance to fully test it, as the manjaro VM that ran the RFC2217 server just kindof killed itself after I shut it down and I don't really have the mental energy to fix it or set the stuff up on another one.
There is/was an even bigger problem though, that being that all the bitmaps are getting corrupted (the Hub plot example worked fine though). This even happens when I run PNut directly on the VM that has the P2 attached. I think there's a buffer size issue, but I could not figure out where you can change that on Linux. Maybe it's also limitation of the USB passthrough driver? idk
(oop, didn't mean to capture both monitors)
Ken said he'll get me an Edge set, so I guess I'll just wait for that to come here.
Yes, it looks like you have a comm problem. Maybe a lower baud rate would help. No worries about testing. I just wondered.
You're doing what? That's Pnut running on Wine on Linux (KDE) in a VM on Win10 ... Ah, no, RFC2217 is for Telnet I see ... So you're doing a remote desktop into a Linux box running Pnut on Wine. And the graphics isn't completely playing ball, by the looks. Is that right?
EDIT: Ah, doh, you've done both.
Certainly, last time I had a play with PNut's debug features everything worked as expected. That was a few releases back though ...
Yep, still working on Kubuntu 20.04 with HWE and newest nVidia blob. The comport is via USB2.0 extension cable to a mains powered USB hub for the RevB Eval Board.
Huh, now you've said that, I ran it again ... this time the offset is same for all the images. I was resizing the "debug output" window while it was processing last time.
PS: I do get some leftover clipping in the right side of the debug output window. Eg:
That offset is due to an insufficient initial delay. While the windows are opening, you want to delay the data flow for maybe half a second in such a case. The new Propeller Tool is going to fix this by having all the serial on a separate thread.
@"Moderator Monkey" Please remove this message! I've submitted it as an issue.
Just tried the install and got the following message:
This is due to the fact that even though the Font directory doesn't show the Parallax font installed, Powershell still shows it there. Worst yet, Powershell running as administrator can't remove it either. Choose "Skip this file" then manually drop the Parallax font from the 2.5.0 install folder (\Program Files (x86)\Parallax Inc\Propeller Tool) onto the Fonts directory and it will correct the problem .
Hmmm, in Virtualbox VM with win10 running the newer version of PropTool 2.5.0, I now can't detect the Propeller with F7 "Identify Hardware..."
After the dialog saying "Checking COM3"
It says "Communication Error: No Propeller found on any serial port. Scanned COM3."
The P62,63 LEDs on the P2-EVAL (and the SPI pin LEDs) do seem flash a bit when it does this, so it is apparently connecting to the USB port attached to the P2-EVAL board.
I sometimes then get another dialog saying "Communication Error: communication stalled due to system problem."
In the preferences window I have tried setting both AUTO and COM3. And only one PORT ID shows up int the "Edit Ports...." dialog (COM3, which says Present Yes).
Restarting the PropTool app, rebooting the machine and retrying, plugging and unplugging the USB cable, uninstalling and re-installing the app and or its drivers do not appear to fix the issue. Maybe some reset probing timing is too tight in the new code if the machines are running slower than native PCs?
I don't know what to try next, apart from downgrading to the prior version. I hope that still works again or else I am SOL with PropTool tests.
PS. All DIP switches are OFF. I hope that is the correct setting for the RevB P2-EVAL board.
Update: AHA! Had an SD card fitted on the board, removed it and now the P2 is detecting! Weird that didn't happen in the prior version.
Comments
Michael, I realized that I just described the .obj file format, not the .bin file format.
The .bin file format is simply the bytes that are ready to send. The .bin file is only produced when you download to the P2.
In the case of Spin2 programs, the first thing is the interpreter program, then your binary object.
In the case of PASM programs, it's just the raw program data.
If you did a Ctrl-F11 (From PNut), to program the Flash chip, it will be either of the above, preceded by the Flash programmer.
Basically, the .bin file is the raw data to be downloaded, without any modification. If you look at the last section of the silicon doc, you can see the download protocol. It's all textual and pretty straightforward. You can do hex, which is really obvious, but text (BASE64) is more data-efficient, so it's faster.
I just posted a new v35f, which fixed bugs in DEBUG:
https://drive.google.com/file/d/1VMHnSO4sf7-hTPewo-SH91PsvA5XBPZb/view?usp=sharing
A new version PNut_v35g has been posted at the top of this thread and here:
https://drive.google.com/file/d/1d9lA2mjJFsBxPtUjaVOMJHF7XuiQA02_/view?usp=sharing
I fixed the floating-point exceptions that could cause PNut to malfunction when doing graphical DEBUG displays. Also, DEBUG windows now close properly and the line-clipping now works like it's supposed to. I adopted the Cohen-Sutherland line-clipping algorithm, which works better than the one I had written. Mine was causing the occasional exception to occur. So, this version is just better-behaved. Jeff will be integrating this version of DEBUG into the Propeller Tool in the next few days.
2000000 is not a standard baud rate and because of very old, very stupid code, setting such a baud rate doesn't forward properly over an RFC2217 connection, so it'd be great if the debugger baud rate could actually be changed
I need to add one more symbol to actually inhibit DEBUG displays from opening, instead of using a non-2Mbaud declaration.
I've been reluctant to change the DEBUG-display baud rate, because DEBUG communication continues right after download. Changing the baud rate could disrupt that. It might necessitate putting a time delay into the DEBUG initializer in the P2 code. If Windows lets me change the baud rate without forcing a serial port reset involving toggling control signals and such, that would make it simpler.
But, why would you want to change the DEBUG-display baud rate, since it's tightly tied to the Windows apps (PNut and Propeller Tool)? Or, are you just wanting the main DEBUG black/green window to open at a different baud rate?
As I said, 2M (and other unusual rates) are just not available in certain situations. The aforementioned RFC2217 tunneling setup (which I'm using to get around the buggy USB serial on the P2D2 I've gotten my hands on, but is just generally useful if the P2 is connected to a different computer) just sets the nearest supported rate instead (that being 1M). The download, being autobaud-ed, works fine, but the debugger then tries to send at 2M and only gibberish comes through. If I set DEBUG_BAUD to a different rate, the data comes through, but the debug windows don't open, which kindof defeats the point.
So yes, if the debugger would just open regardless of set DEBUG_BAUD, that would work here.
Well, turns out that quickly opening the debug window with F12 after downloading makes stuff work.
So here it is, Spin2 debugging forwarded over network (well, between a VM and its host...)
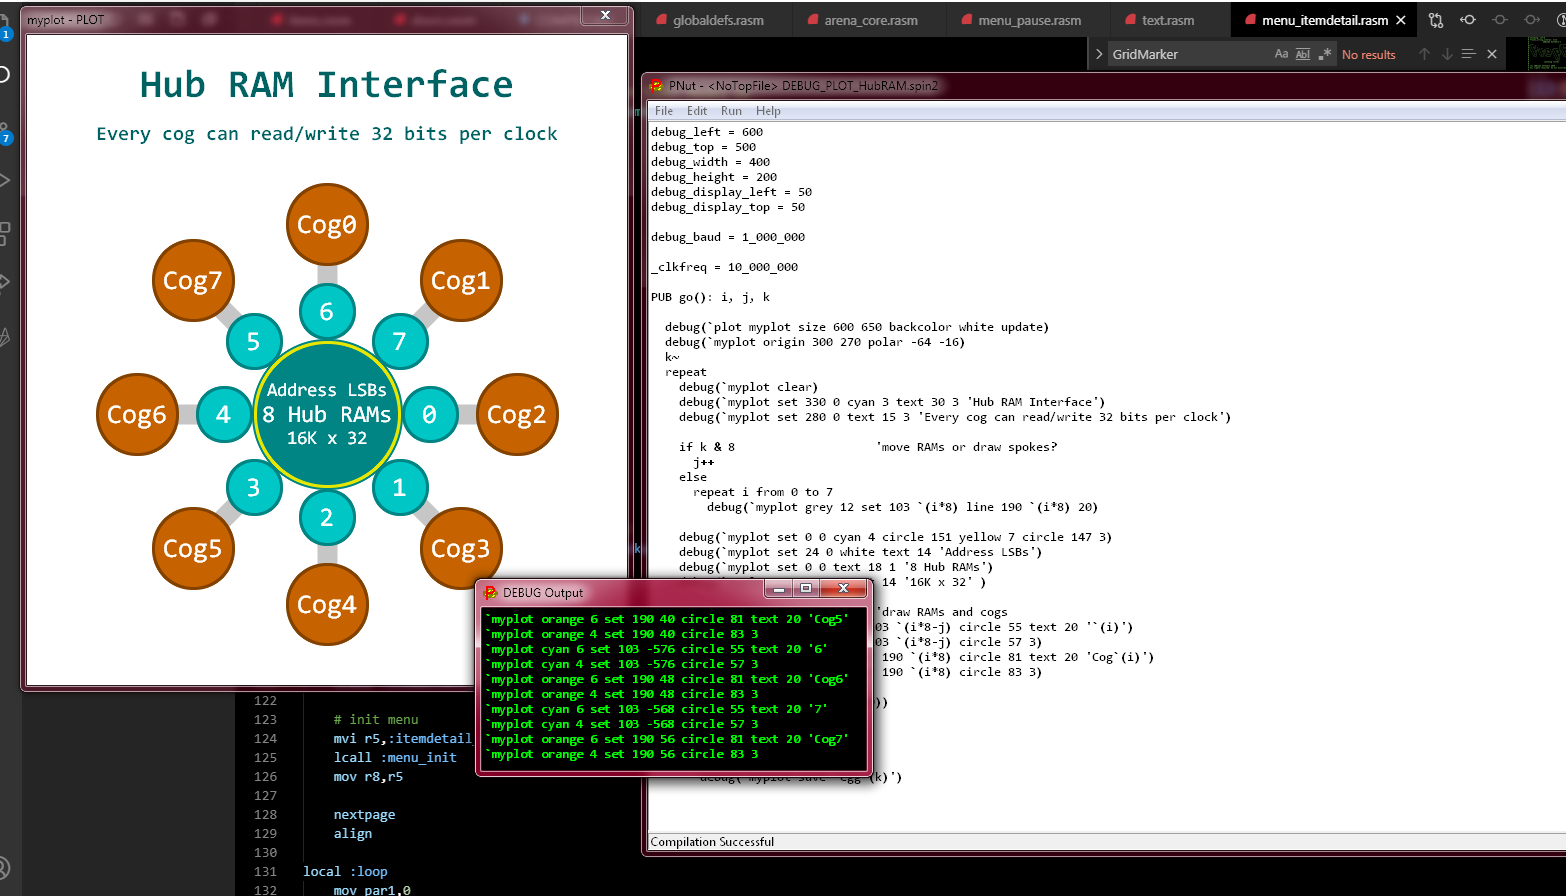
Problematically, the bitmap examples all get kinda corrupted, some buffer somewhere is probably to small.
That's interesting that it can work that way. I will make the baud changeable. If it gets lowered, it should work on your setup, right?
A new version 35h was just posted:
https://drive.google.com/file/d/1zLtHxj_E3YUjmzQg3QjjP_ZwgkQvO0VW/view?usp=sharing
The Spin2 interpreter was shifted around a bit to free the first 16 LUT registers, to support 1/2/4-bit video in the same cog, via interrupt.
A new symbol DEBUG_WINDOWS_OFF was added to inhibit any DEBUG windows from opening after downloading. DEBUG_BAUD can now change the baud rate that PNut and the P2 communicate at.
With 16 LUT registers available, the DDS/Goertzel can work, too.
Is it a good idea to start referring to LUT RAM as registers?
Well, what have we been calling them?
The doc makes a clear distinction between COG and LUT RAM:
"16 LUT longs" is what I'd call them in this case.
Great. It's always a good idea to allow user BAUD control, as not all serial links are using the same drivers and pathways.
Usually someone would choose the fastest useful speed, which may be 1M for the RFC2217 mentioned above, or it may be 3MBd or even up to 12MBd for someone using a P2 with a FT232H/FT2232H Bridge.
The UB3 in the P2D2 can manage bursts faster than 3Mbd, so depending on the debug packet size, values above 3MBd might be practical there too. ( 24MHz/N is the supported formula)
Until SiLabs fix their driver bug** of a purely SW imposed baud ceiling, for the UB3 with values above 3MBd 1MBd are accessed by setting the N value. (eg so Baud=6 gives 4MBd link speed)
** addit:
I just downloaded the Silabs driver 10.1.10.103, and even tho the release notes say this MCUSW-651 | Support baud rate up to 2187500 for CP2102, CP2104, CP2109
it now allows me to enter any value up to 12Mbd for UB3 without coughing any (bogus in my mind) SW error for values above 1MBd, so they have fixed that issue
(replying in this thread because on-topic)
Yes, seems to work. I haven't had a chance to fully test it, as the manjaro VM that ran the RFC2217 server just kindof killed itself after I shut it down and I don't really have the mental energy to fix it or set the stuff up on another one.
There is/was an even bigger problem though, that being that all the bitmaps are getting corrupted (the Hub plot example worked fine though). This even happens when I run PNut directly on the VM that has the P2 attached. I think there's a buffer size issue, but I could not figure out where you can change that on Linux. Maybe it's also limitation of the USB passthrough driver? idk
(oop, didn't mean to capture both monitors)
Ken said he'll get me an Edge set, so I guess I'll just wait for that to come here.
Yes, it looks like you have a comm problem. Maybe a lower baud rate would help. No worries about testing. I just wondered.
You're doing what? That's Pnut running on Wine on Linux (KDE) in a VM on Win10 ... Ah, no, RFC2217 is for Telnet I see ... So you're doing a remote desktop into a Linux box running Pnut on Wine. And the graphics isn't completely playing ball, by the looks. Is that right?
EDIT: Ah, doh, you've done both.
Certainly, last time I had a play with PNut's debug features everything worked as expected. That was a few releases back though ...
Yep, still working on Kubuntu 20.04 with HWE and newest nVidia blob. The comport is via USB2.0 extension cable to a mains powered USB hub for the RevB Eval Board.
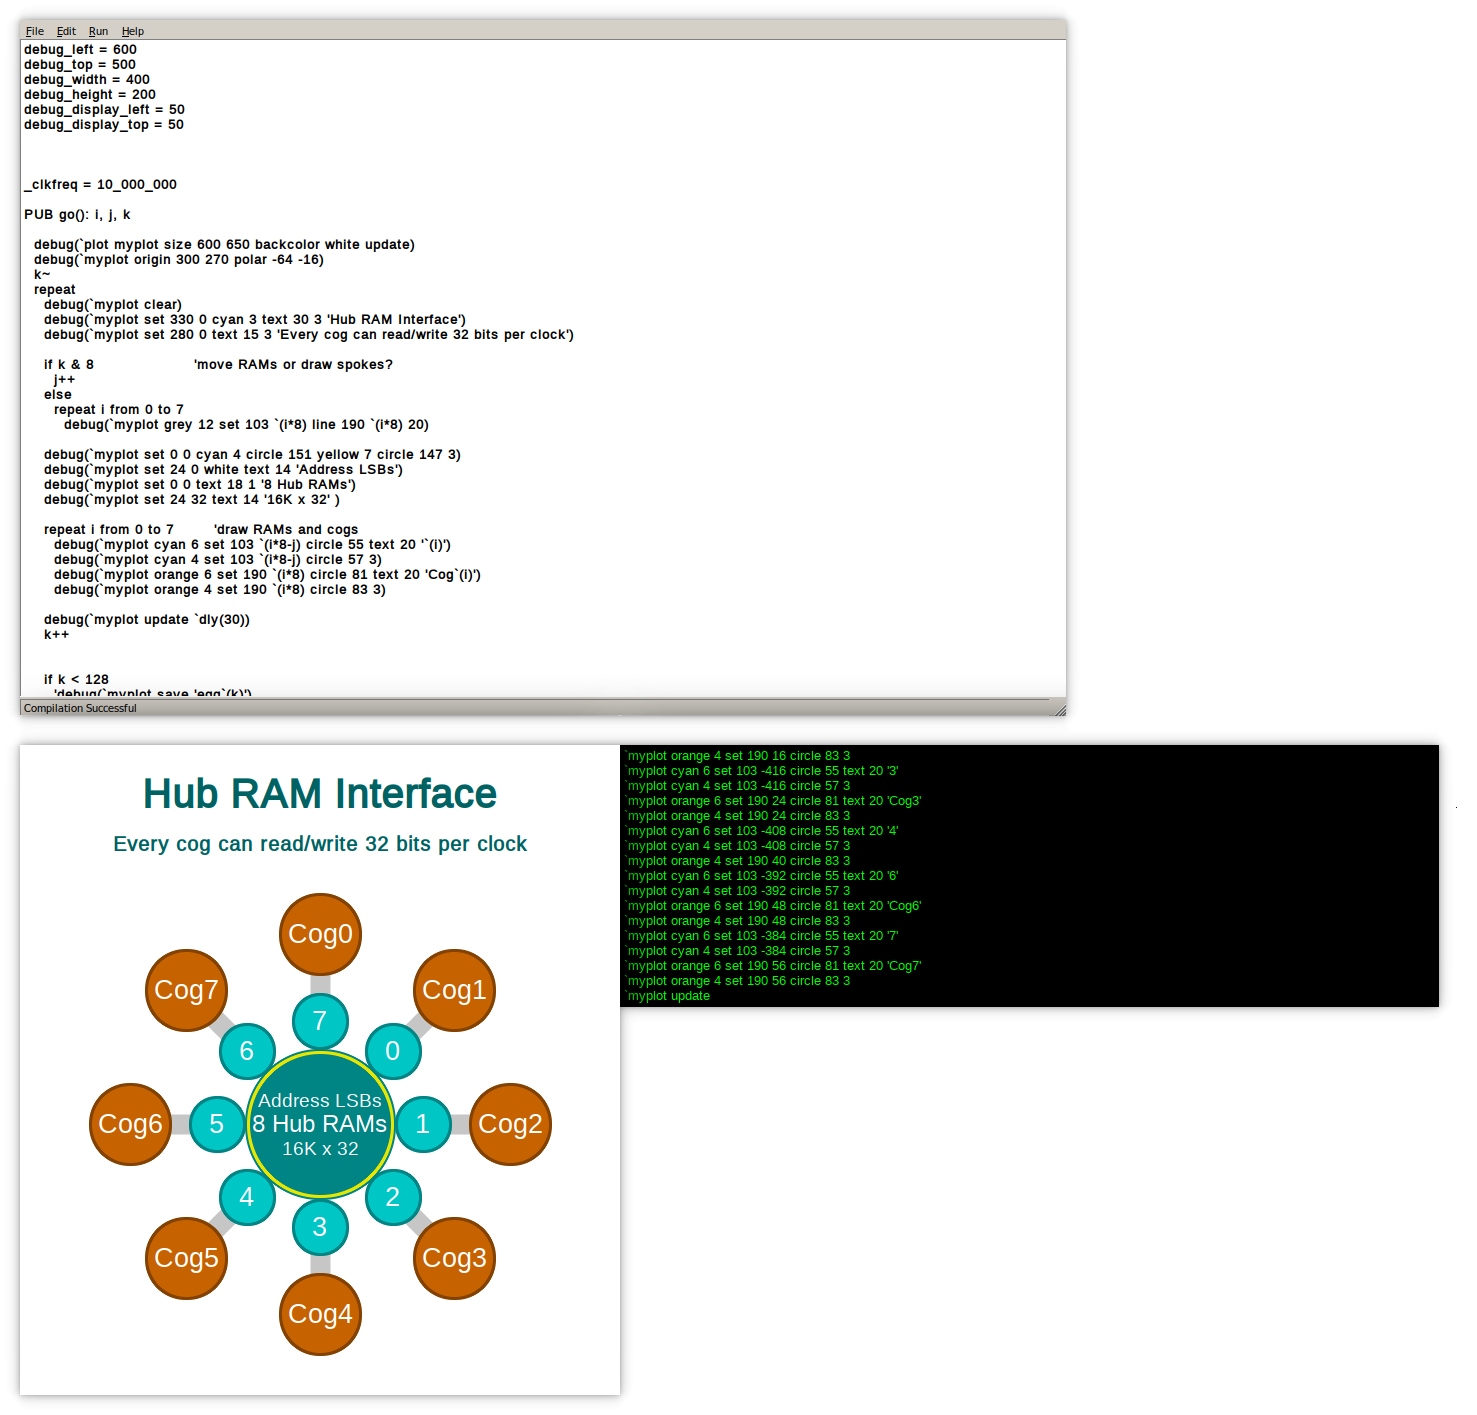
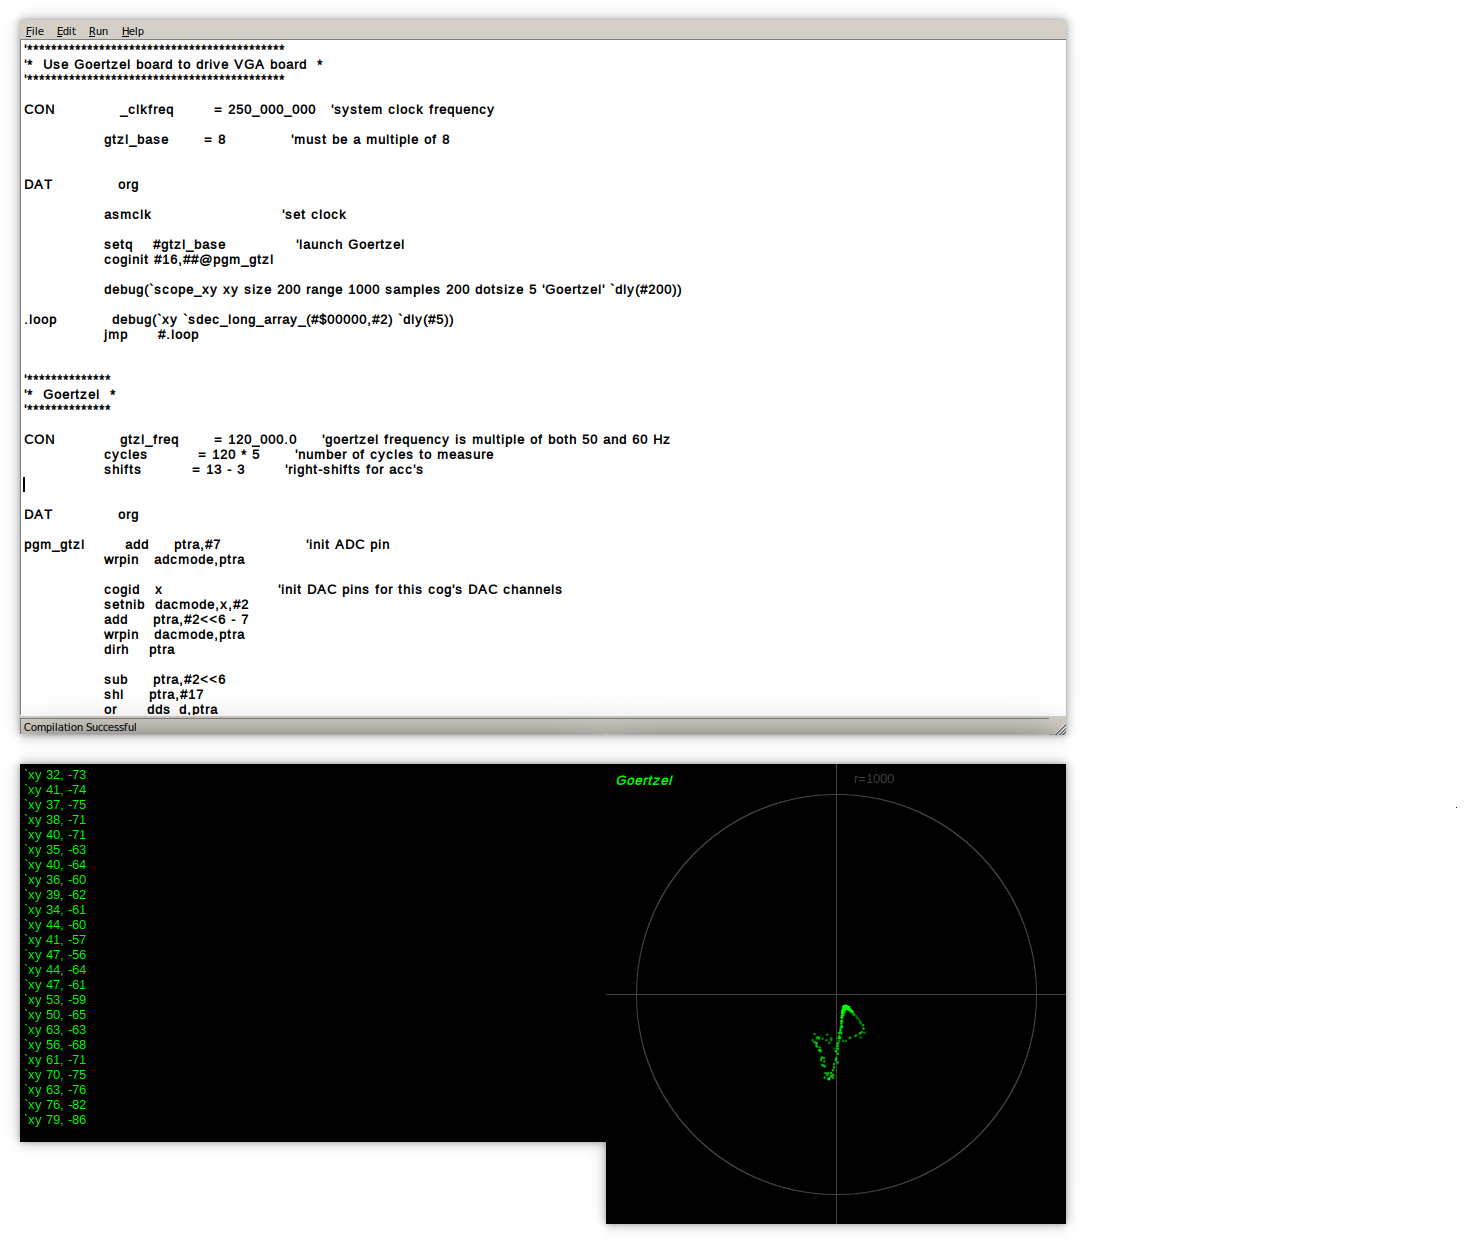
@evanh
That plot graph works for me too, try the
DEBUG_BITMAP_RGB24_Demo.spin2That's mostly ok, but not really, the truecolor bitmaps are offset.
That's on an eval board, right? If you have a P2D2, can you try it on that?
Huh, now you've said that, I ran it again ... this time the offset is same for all the images. I was resizing the "debug output" window while it was processing last time.
PS: I do get some leftover clipping in the right side of the debug output window. Eg:
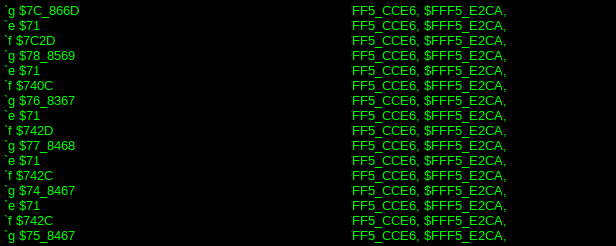
PPS: I only have Eval Boards.
That offset is due to an insufficient initial delay. While the windows are opening, you want to delay the data flow for maybe half a second in such a case. The new Propeller Tool is going to fix this by having all the serial on a separate thread.
Proptool 2.5.0 with debug is out: https://www.parallax.com/package/propeller-tool-software-for-windows-spin-assembly-2/.
I just need a few simple programs that use DEBUG so I can see how it works.
@"Moderator Monkey" Please remove this message! I've submitted it as an issue.
Just tried the install and got the following message: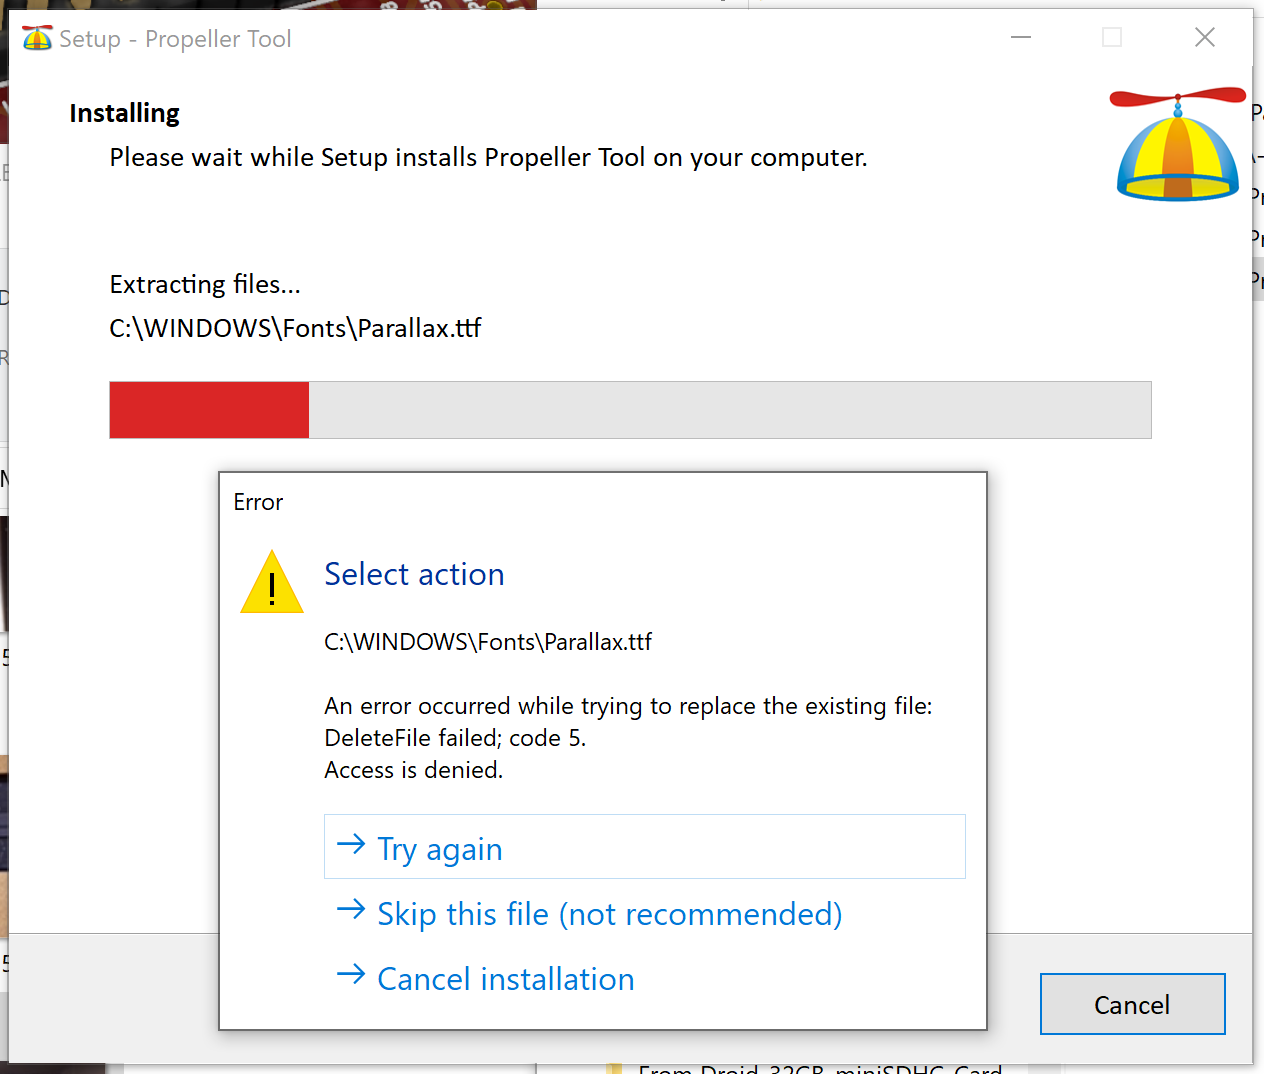
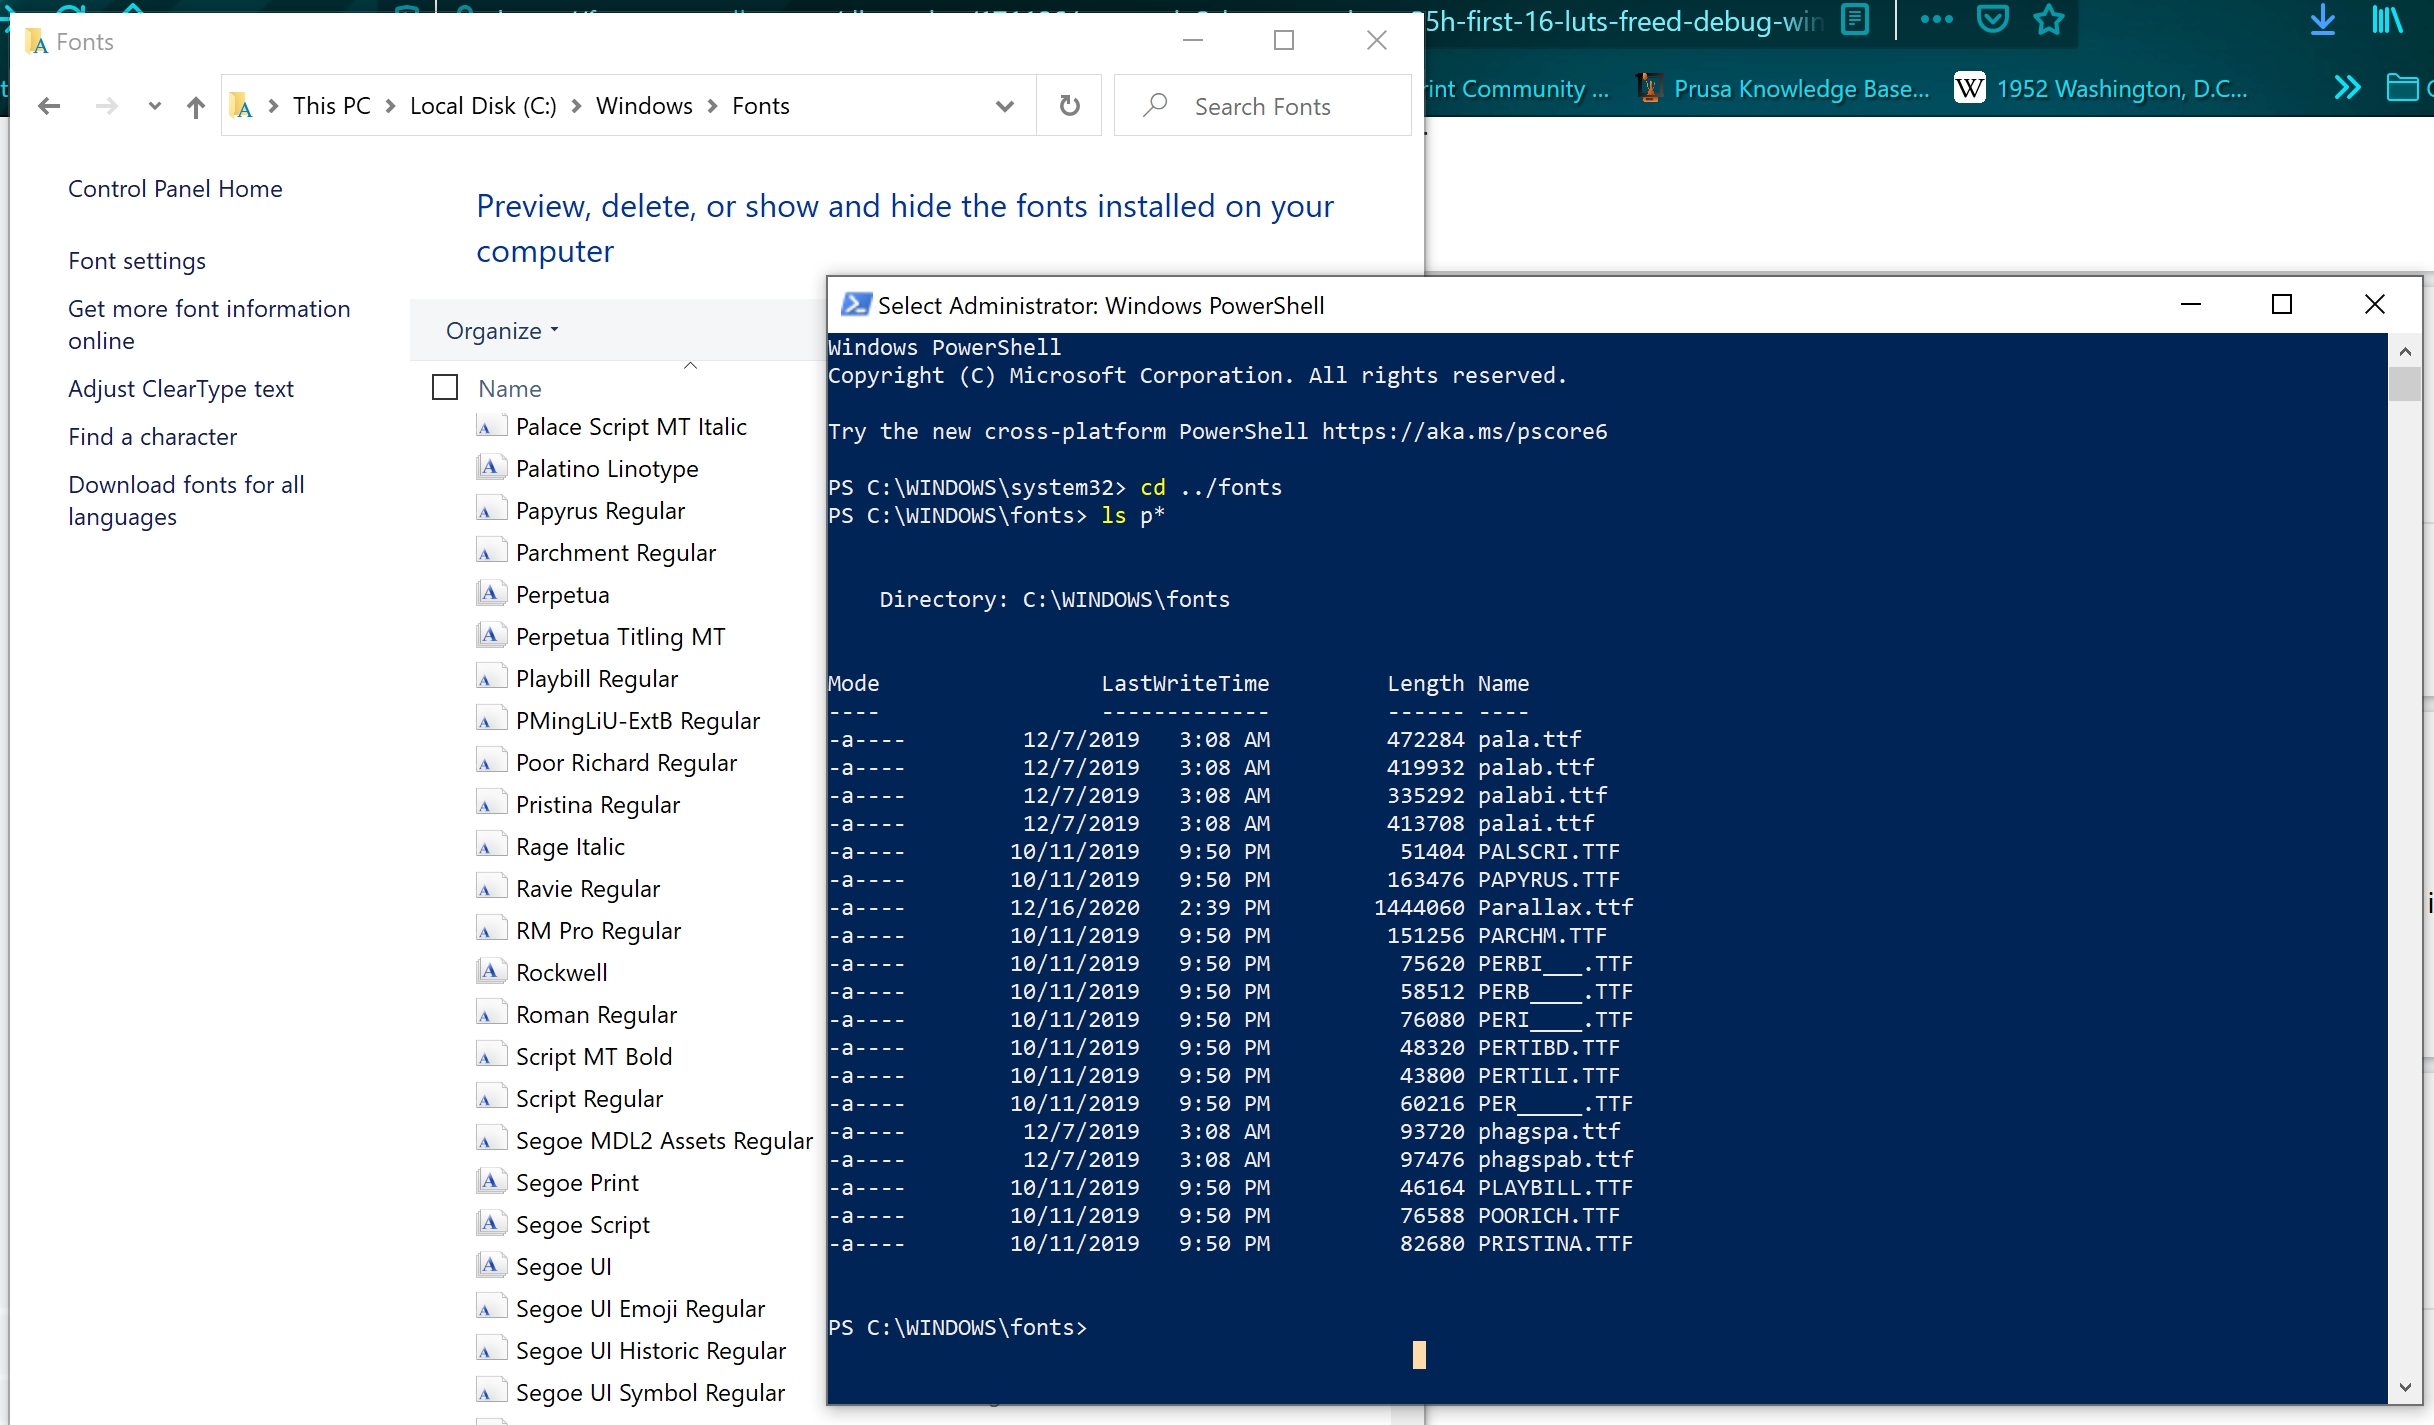
This is due to the fact that even though the Font directory doesn't show the Parallax font installed, Powershell still shows it there. Worst yet, Powershell running as administrator can't remove it either. Choose "Skip this file" then manually drop the Parallax font from the 2.5.0 install folder (\Program Files (x86)\Parallax Inc\Propeller Tool) onto the Fonts directory and it will correct the problem .
Trying out the new version of Prop Tool with debug. Very nice! It's good to be working in an environment I'm used to!
PropTool 2.5.0 on Wine fails to detect the propeller chip.
Hmmm, in Virtualbox VM with win10 running the newer version of PropTool 2.5.0, I now can't detect the Propeller with F7 "Identify Hardware..."
After the dialog saying "Checking COM3"
It says "Communication Error: No Propeller found on any serial port. Scanned COM3."
The P62,63 LEDs on the P2-EVAL (and the SPI pin LEDs) do seem flash a bit when it does this, so it is apparently connecting to the USB port attached to the P2-EVAL board.
I sometimes then get another dialog saying "Communication Error: communication stalled due to system problem."
In the preferences window I have tried setting both AUTO and COM3. And only one PORT ID shows up int the "Edit Ports...." dialog (COM3, which says Present Yes).
Restarting the PropTool app, rebooting the machine and retrying, plugging and unplugging the USB cable, uninstalling and re-installing the app and or its drivers do not appear to fix the issue. Maybe some reset probing timing is too tight in the new code if the machines are running slower than native PCs?
I don't know what to try next, apart from downgrading to the prior version. I hope that still works again or else I am SOL with PropTool tests.
PS. All DIP switches are OFF. I hope that is the correct setting for the RevB P2-EVAL board.
Update: AHA! Had an SD card fitted on the board, removed it and now the P2 is detecting! Weird that didn't happen in the prior version.